market timing model: BUY
Current signal generated on close of November 13.
Portfolio exposure can be anywhere from 50 to 100% long. If positions are holding up well, then one can add exposure beyond 100%.
Past signals:
- Neutral signal generated on close of November 6.
- Buy signal generated on close of September 9
- Neutral signal generated on close of August 15
- Buy signal generated on close of July 11
- Neutral signal generated on close of July 5
- Sell signal generated on close of June 24
today’s watchlist (potential trade entries):

Having trouble seeing the open positions graphic above? Click here to view it directly on your web browser instead.
open positions:
Below is an overview of all open positions, as well as a report on all positions that were closed only since the previous day’s newsletter. Changes to open positions since the previous report are listed in pink shaded cells below. Be sure to read the Wagner Daily subscriber guide for important, automatic rules on trade entries and exits.

Having trouble seeing the open positions graphic above? Click here to view it directly on your web browser instead.
closed positions:
Having trouble seeing the closed positions graphic above? Click here to view it directly on your web browser instead.
ETF position notes:
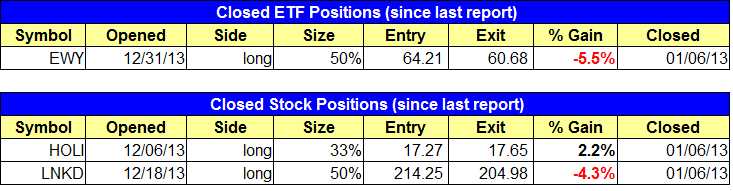
- Stopped out of $EWY (what an ugly reversal!).
stock position notes:
- Stopped out of $HOLI for a small gain. Stopped out of $LNKD on a breakdown below the 200-day MA. $TOWR buy stop triggered and we are long.
ETF, stock, and broad market commentary:
Stocks sold off once again on Monday, with all main averages closing in negative territory and in the -0.3% to -0.8% range. While the losses were were limited to 0.3% in the S&P 500 and -0.4% in the NASDAQ, total volume increased on both exchanges, producing a bearish distribution day.
The S&P 500 has support from a prior swing high and the 20-day moving average around the $1,810 – $1,815 area. There is also support from the rising 50-day MA just below $1,800. So the S&P 500 should find support between $1,800 to 1,815 if the market is to remain healthy.
Our long position in the Financial Bull 3x ETF ($FAS) is up 15% from our entry on Nov. 14. As such, we are going with a tight stop to lock in gains (note the new stop price in the open positions section above).
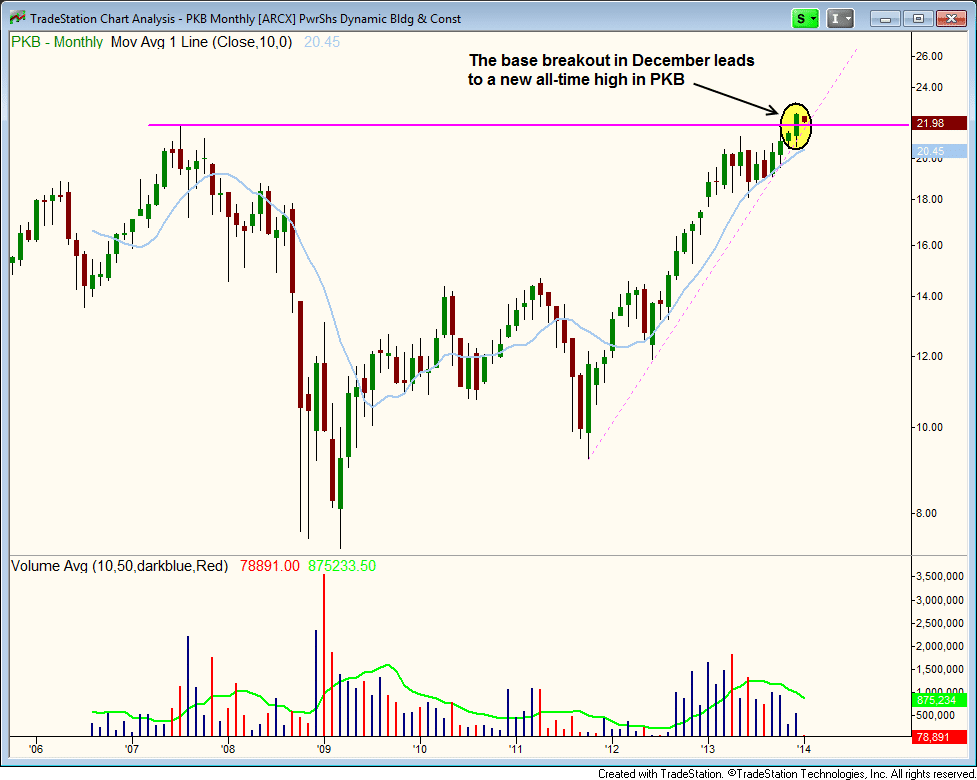
After breaking out from a strong base in December, PowerShares Dynamic Building & Construction ETF ($PKB) has stalled out is now in pullback mode. The first pullback after a strong breakout is usually a good spot to add to an existing position or establish a new positio if the original breakout entry was missed.
The price action undercut the 10-day MA on Monday, but the 20-day EMA is just below, so there is decent support in the $21.80 – $22 range.
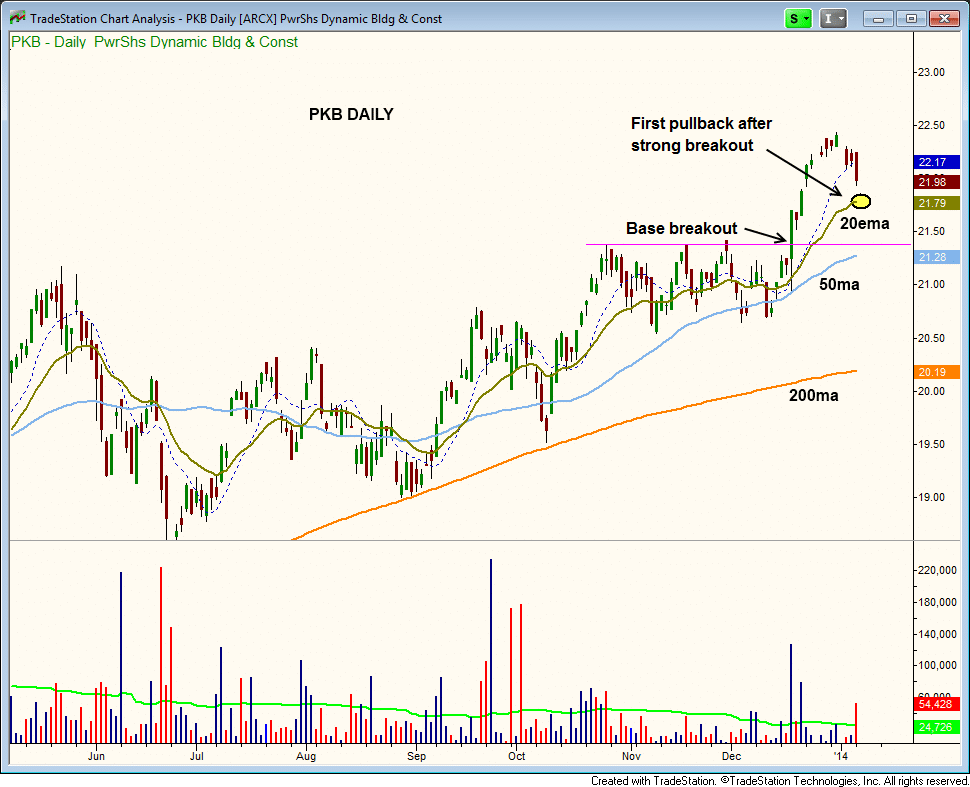
We’d like to take advantage of what we expect to be short-term weakness in $PKB by placing a buy limit order. Trade details can be found above.
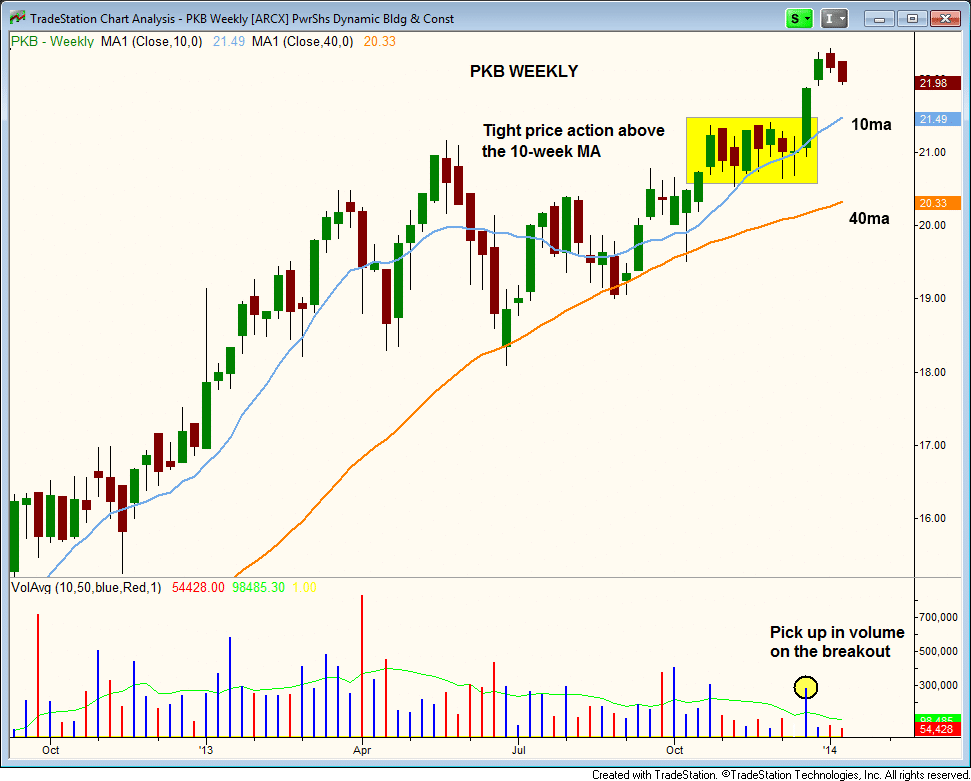
As mentioned in past reports, our favorite setups tend to be the ones where there is some sort of downtrend line breakout or base breakout on multiple time frames (the daily, weekly, and monthly). Multiple time frame setups can produce explosive price action, so it pays to dig a little deeper than the daily chart.
The chart below confirms the breakout action on the weekly chart in $PKB. Note that the 10-week moving average (light blue) at 21.49 is already above the highs of the last range. This is a great sign, as this average will offer a ton of support (above the last base high) should the price action continue to sell off.
The monthly chart shows the breakout to new all-time highs. With a breakout on the daily, weekly, and monthly charts, $PKB is setting up for an explosive run over the next several months.
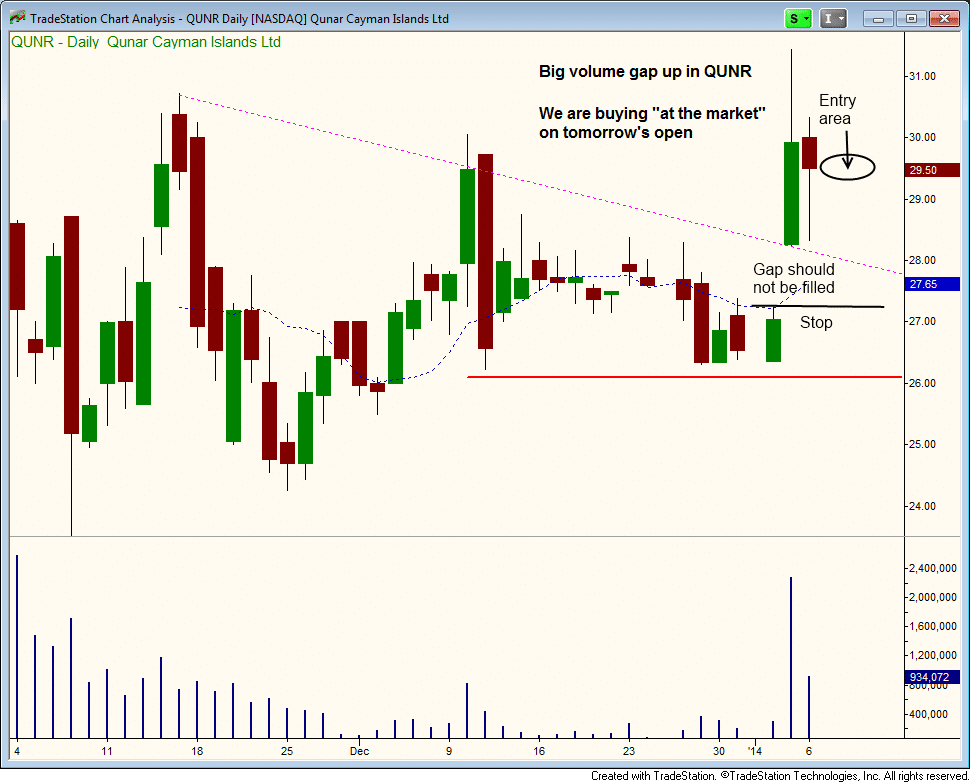
On the stock side we have two new swing setups in recent IPOs $QUNR and $WUBA. Both of these trades are quick hitters, in that we are not looking to hold through a correction like we would in an A rated stock.
$QUNR strong price and volume action on the gap up is too good to pass up. We are entering tomorrow at the market on the open, looking for a fill somewhere around yesterday’s close. The exit for now is a failure of the gap, but if the price action dips below the two-day low we may decide to cut partial or all the position.
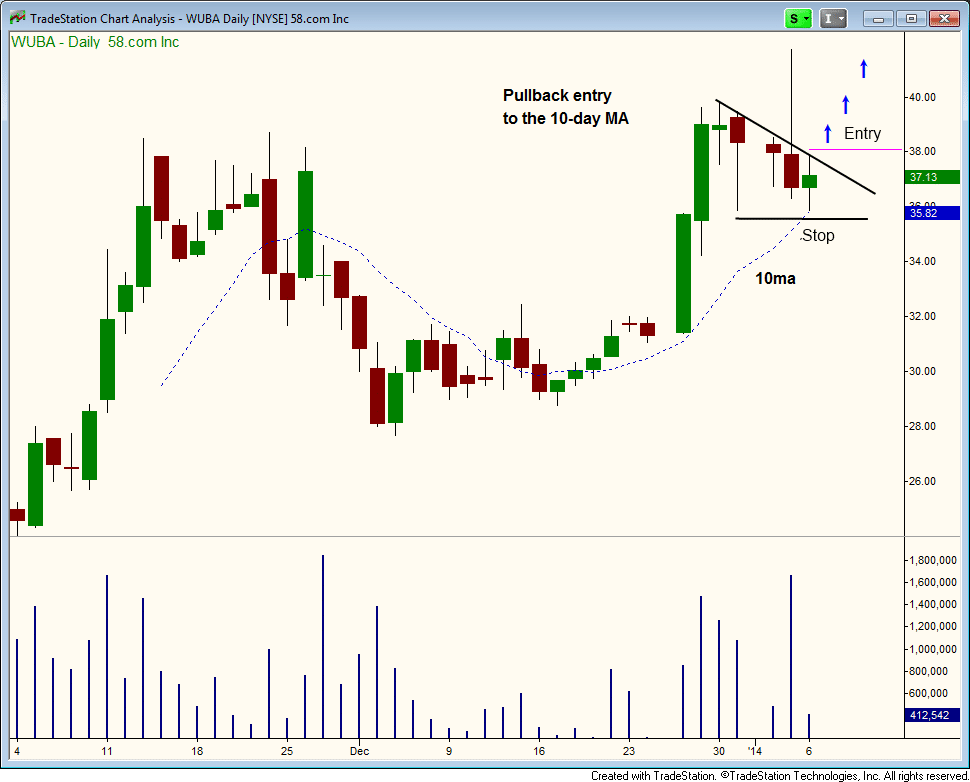
After stalling out at the highs of the range, $WUBA has pulled back in to the rising 10-day MA. We are placing a simple buy stop order above Monday’s high with a stop beneath Monday’s low. We call these tight setups a GONG (go or no go), because the action should move out right away.