Portfolio exposure can be anywhere from 75 to 100% long. If positions are holding up well, then one can add exposure beyond 100% (for experienced traders only).
Past signals:
- Neutral signal generated on close of November 6.
- Buy signal generated on close of September 9
- Neutral signal generated on close of August 15
- Buy signal generated on close of July 11
- Neutral signal generated on close of July 5
- Sell signal generated on close of June 24
today’s watchlist (potential trade entries):

Having trouble seeing the open positions graphic above? Click here to view it directly on your web browser instead.
open positions:Below is an overview of all open positions, as well as a report on all positions that were closed only since the previous day’s newsletter. Changes to open positions since the previous report are listed in pink shaded cells below. Be sure to read the Wagner Daily subscriber guide for important, automatic rules on trade entries and exits.

Having trouble seeing the open positions graphic above? Click here to view it directly on your web browser instead.
closed positions:
Having trouble seeing the closed positions graphic above? Click here to view it directly on your web browser instead.
ETF position notes:
- $GREK buy limit order triggered. Please cancel the buy stop order.
stock position notes:
- $AL buy stop triggered over the 5-minute high.
ETF, stock, and broad market commentary:Stocks closed higher with moderate percentage gains for the most part except for the Dow Jones, which slipped -0.3%. Volume ticked higher on the NYSE, producing an accumulation day for the S&P 500. Volume was lighter on the NASDAQ.
All the major averages are trading above the 20-day EMA, with the NASDAQ, S&P 400, and Russell 2000 above the 10-day MA. When the market averages are in a strong uptrend, it’s best to focus on leading stocks or ETFs and try not to get too caught up in what the major averages are doing intraday.
We do not ignore broad market action, but placing too much emphasis these charts can lead to missed trades, as traders fear calling a top and are unable to “pull the trigger” in a good setup.
The way to avoid becoming too index oriented is to have a solid system in place that allows you to identify bullish stock or ETF patterns. When our scans produce many bullish patterns, this is a sign that the market could be headed higher. By letting the charts dictate what we do, we are able to trade what we see, not what we think.
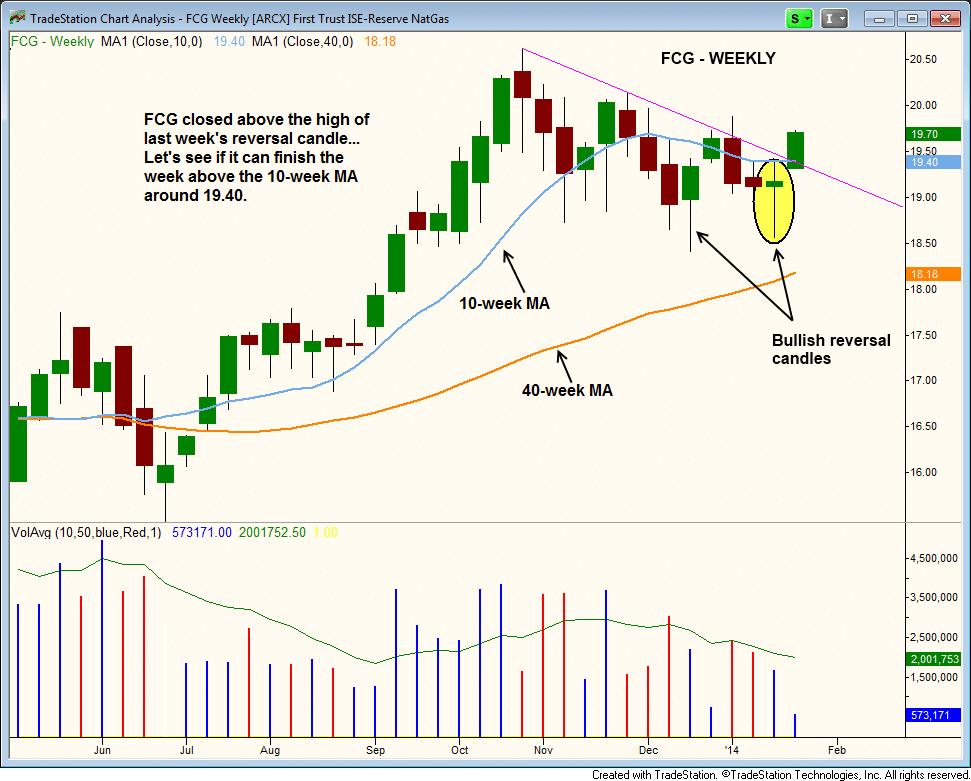
The energy sector was strong on Tuesday, with First Trust ISE Revere Natural Gas ETF ($FCG) gaining 2.8% on above average volume volume. $FCG closed above the 10-week MA and the high of last week’s bullish reversal candle. However, it is just the beginning of the week, so the price action will have to hold up by Friday to confirm the breakout on the weekly chart. Since the volume was strong, we are adding to our existing position. Please see today’s watchlist for trade details.
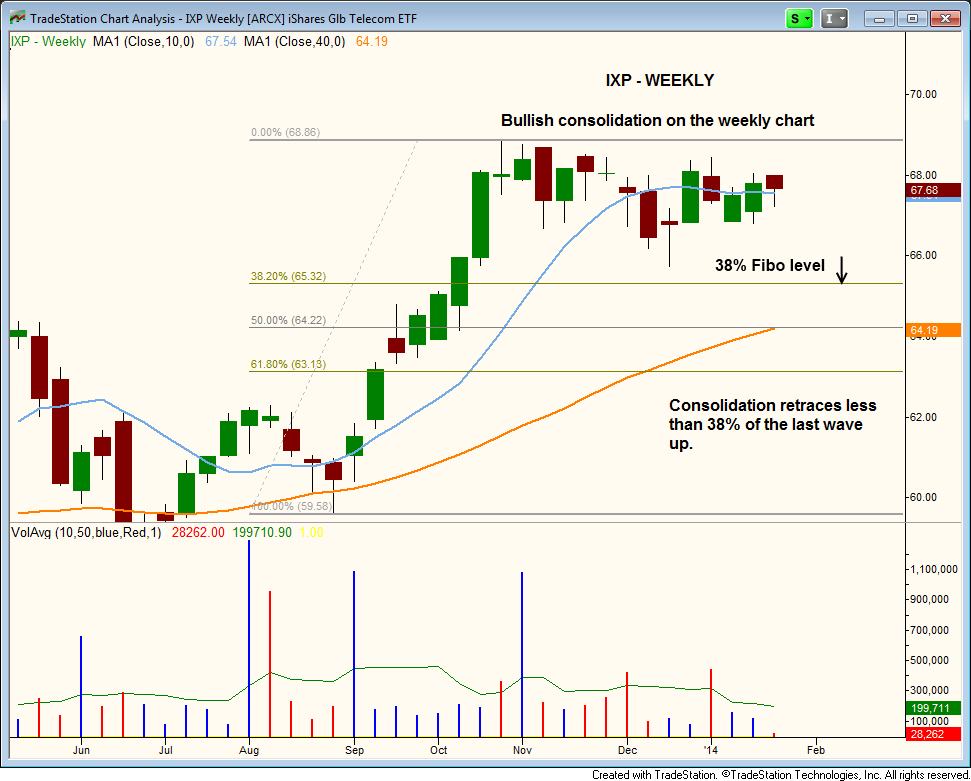
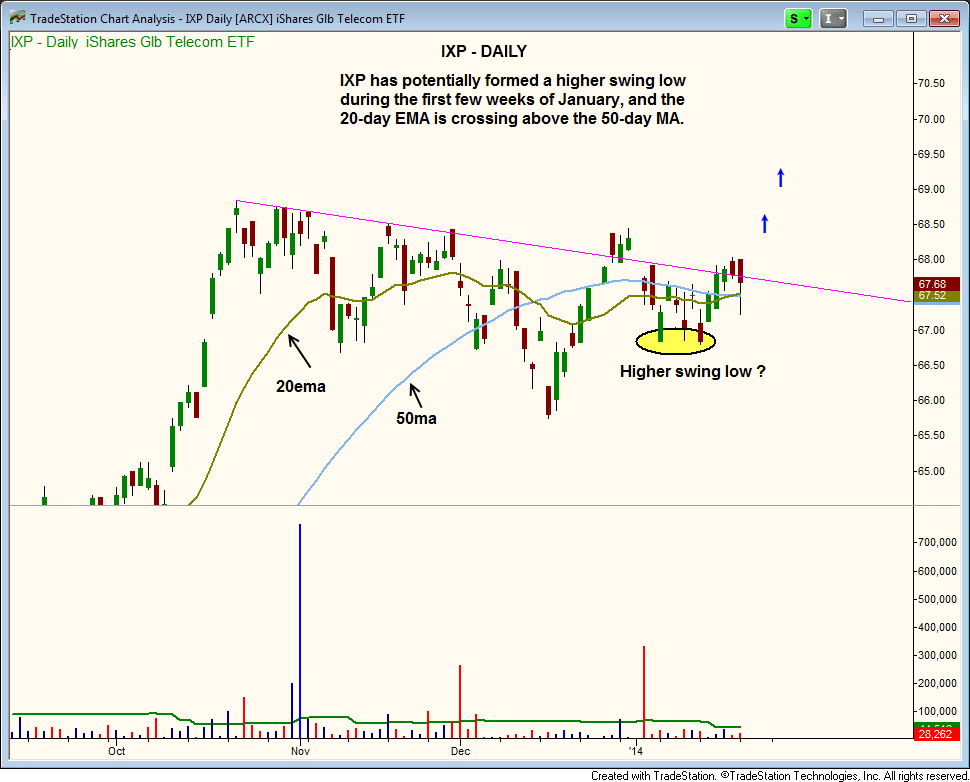
 After a strong seven week rally off the 40-week MA, iShares S&P Global Telecommunications ETF ($IXP) has been in consolidation mode since last October. Note that the current consolidation has given back less than 38% of the last wave up, which is quite bullish.
The past three weeks of price action have been pretty tight, hovering around the 10-week MA. Eventually, a volatility contraction will lead to a volatility expansion, though not always to the upside.
 The $IPX daily chart shows a potential higher swing low in place. This low is not officially a higher swing low until the price action clears the last swing high. Tuesday’s reversal candle could also offer another higher low within the base….if it holds. Higher lows show a tightening of the price action, which is usally a bullish sign after a lengthy consolidation.
A breakout above the dirty downtrend line drawn on the daily chart below is a buy entry. We call it a dirty downtrend line because there are a few bars that violate the line. Drawing trend lines in our opinion is more about common sense then some rule in a technical analysis book. Whichever line has the most touches is the one we usually go with (keep it simple).
 Our $GREK buy entry triggered on a pullback yesterday. The price action should hold above the 50-day MA, if not, then the action may need a few more weeks of work.
On the stock side, we added to $AL over the 5-minute high. The price and volume action closed strong, so we should see some decent follow through in the short-term. There should be some resistance around the prior high, but $AL should eventually push to new all-time highs. Check out a monthly chart, it has no resistance above.
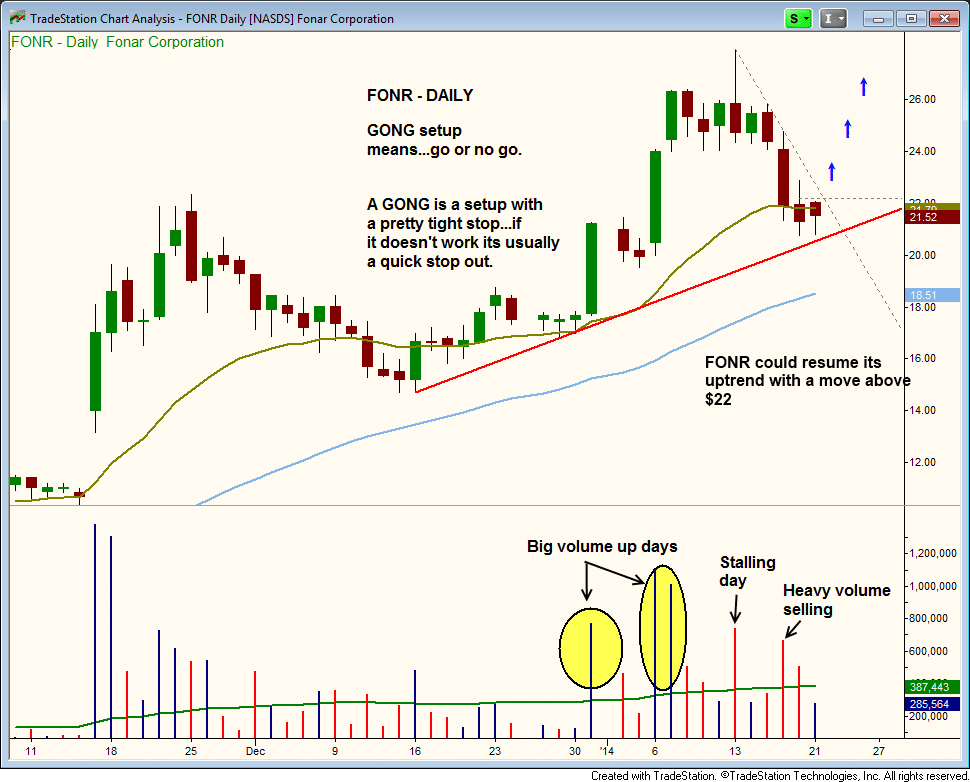
We have two new setups tonight in $FONR and $PGTI. $PGTI is a pullback entry to the prior breakout level around 10.60. The stop is fairly loose because the action is still within the base and may become volatile for a day or two. Overall, the pattern looks great and the stock does have some decent earnings growth, so it has potential and could turn into a longer-term hold if all goes well.
$FONR is a potential entry over the hourly downtrend line and yesterday’s high. This will put the action back above the 20-day EMA.
There was strong volume on the move up, with one day of stalling at the highs and one day of selling (last Wednesday). Look for the volume to pick up on a move above $22. This is a G.O.N.G. setup, which means go or no go. We usually stop out pretty quick if the action doesn’t go our way.