Confirmed Buy– Signal generated on the close of January 22 (click here for more details)
today’s watchlist (potential trade entries):

Having trouble seeing the open positions graphic above? Click here to view it directly on your web browser instead.
open positions:
Below is an overview of all open positions, as well as a report on all positions that were closed only since the previous day’s newsletter. Net P/L figures are based on two separate $50,000 model portfolios (one for ETFs and one for stocks). Changes to open positions since the previous report are listed in pink shaded cells below. Be sure to read the Wagner Daily subscriber guide for important, automatic rules on trade entries and exits.
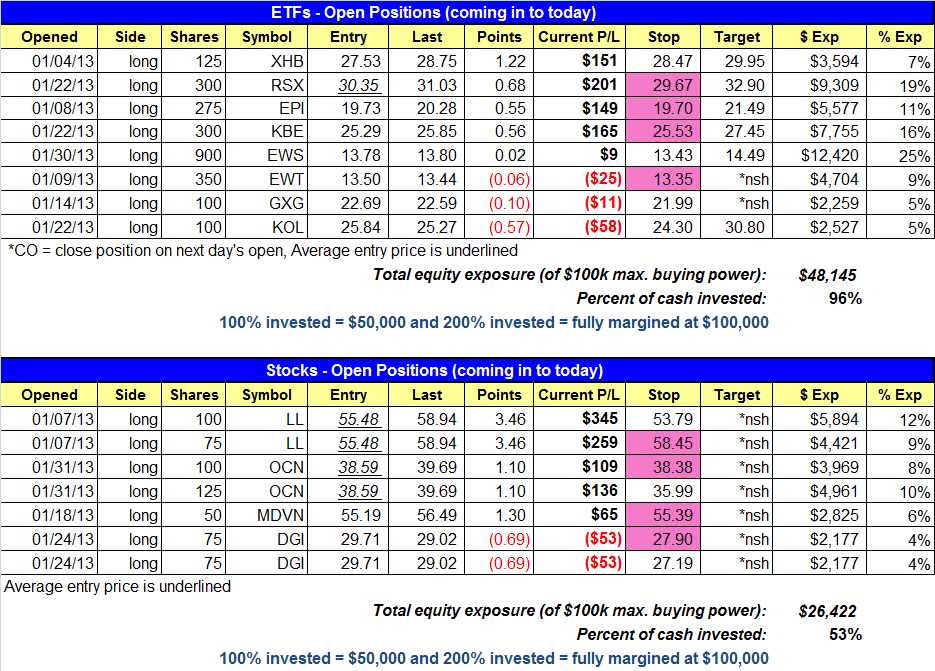
Having trouble seeing the open positions graphic above? Click here to view it directly on your web browser instead.
closed positions:
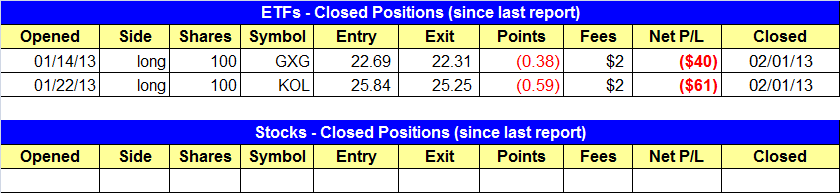
Having trouble seeing the closed positions graphic above? Click here to view it directly on your web browser instead.
ETF position notes:
- Partial sells in $GXG and $KOL triggered on the open (per yesterday’s commentary).
stock position notes:
- No trades were made.
ETF, stock, and broad market commentary:
Stocks recovered from Thursday’s heavy selling action by gapping higher and following through. By the close, most major averages were up at least 1% with all averages closing at a new swing high. Turnover eased on the session, so technically it was not an accumulation day.
Thursday’s distribution was sure to attract some short selling, and those who did were caught with their hands in the cookie jar by the morning gap up. While we have no problems going short, we do not go short against the prevailing trend when there is a clear buy signal in place.
Trying to call a top when the market is in trend mode is something that we have tried to do in the past, and have learned that it hardly ever works. Even if we did eventually did get it right, it was always after several failed attempts, so it was basically a wash at best (most of the time).
Also, more important than the losses on failed short attempts was the psychological damage done, as it was emotionally draining to fight the trend. There is basically nothing more important to trading success (in the longer term) than protecting capital and preserving confidence. Any weakness in these two areas will eventually prevent you from living to trade another day.
Although Friday’s action was bullish, we continue to trail tight stops to reduce risk and lock in gains when possible. Many stops are placed below the 20-day EMA, which should provide support during any pullback in the market.
Can a market continue to rally while in overbought territory? The chart below of the S&P 500 is from 2007, where the S&P rallied for several months without breaking the 10-day MA.

Note the tight price range on the rally, which found support at the 10-day MA after several times after a short, 2-3 day. So the answer is yes, an overbought market can continue to run without a deep pullback. We are not saying the current rally will match the chart above in terms of the percent move or length, as every market rally is unique. This chart simply serves as a guide for what could happen.
We continue to monitor the action in the Global X InterBolsa FTSE Colombia20 ($GXG), which has tightened up nicely the past few weeks. The monthly chart below shows the tight price action and bullish base that has formed over the past year or so. The basing action comes after a strong surge off the lows of 2011.

Our main template for a breakout buy is one where a stock or ETF has already advanced 30-50% off a 52-week low and the 200-day moving average is beginning to trend higher. This means that unless we are buying a trend reversal setup (which is only about 5% of the time or less in a bull market) our stock/ETF has already established a clear uptrend. We do not look for value in a chart, we look for momentum. After a strong run up, we then identify bullish consolidations and wait for the price action to form the right side of the base. The past five months in $GXG is a good example of the right side of a base forming. We’ll continue to monitor $GXG for a breakout entry that holds above 22.70.
On the stock side we have also raised stops on a few positions to lock in some gains and reduce risk. With $OCN, we are going with a split stop to reduce risk in case Friday’s breakout fails. Due to the stalling action in $LL, we also raised the stop on partial size to lock in some gains.
Our scans definitely dried up last week, meaning that there were not many low risk base breakouts or pullback entries to be found, which is what we focus on. $REGN $CRM $THO are potential setups that we could be interested in this week. $REGN and $CRM report earnings on Feb. 14 & 20 respectively, so those positions will be tough to hold if there isn’t much of a profit buffer. $THO does not report earnings until early March.
If you are a new subscriber, please e-mail [email protected] with any questions regarding our trading strategy, money management, or how to make the most out of this report.
relative strength combo watchlist:
Our Relative Strength Combo Watchlist makes it easy for subscribers to import data into their own scanning software, such as Tradestation, Interactive Brokers, and TC2000. This list is comprised of the strongest stocks (technically and fundamentally) in the market over the past six to 12 months. The scan is updated every Sunday, and this week’s RS Combo Watchlist can be downloaded by logging in to the Members Area of our web site.