market timing model:
Buy – Signal generated on the close of August 16 (click here for more details)
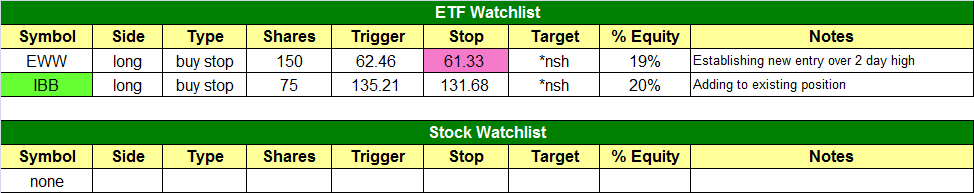
today’s watchlist (potential trade entries):
Having trouble seeing the open positions graphic above? Click here to view it directly on your web browser instead.
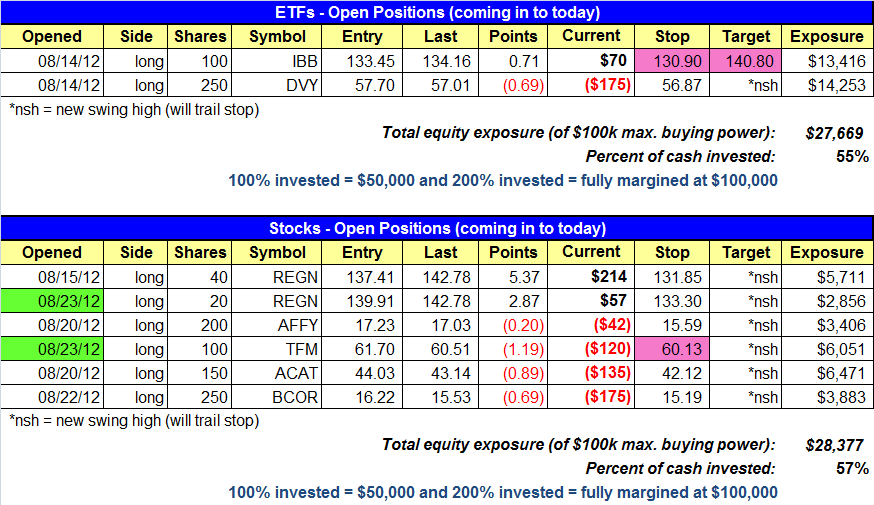
open positions:
Below is an overview of all open positions, as well as a report on all positions that were closed only since the previous day’s newsletter. Net P/L figures are based on two separate $50,000 model portfolios (one for ETFs and one for stocks). Changes to open positions since the previous report are listed in pink shaded cells below. Be sure to read the Wagner Daily subscriber guide for important, automatic rules on trade entries and exits.
Having trouble seeing the open positions graphic above? Click here to view it directly on your web browser instead.
closed positions:

Having trouble seeing the closed positions graphic above? Click here to view it directly on your web browser instead.
ETF position notes:
- Note the changes highlighted above in the open position and watchlist section. Specifically, we have raised the stop and target prices for IBB, and have listed a setup to add additional shares to IBB as well. Notice it will initially be a “split stop” on the IBB position if additional shares trigger for entry. New stop on EWW setup (re-entry play).
stock position notes:
- TFM and REGN both triggered for buy entry. REGN is listed twice due to the “split stops” between the original shares and added shares.
ETF and broad market commentary:
Failing to follow through on the previous afternoon’s bullish reversal, stocks sold off across the board yesterday. However, slightly lighter volume eased the sting. The Nasdaq Composite ($COMPQ) lost 0.7%, the S&P 500 ($SPX) fell 0.8%, and the Dow Jones Industrial Average ($DJIA) slid 0.9%. The small-cap Russell 2000 ($RUT) and S&P MidCap 400 ($MID) declined 0.8% and 0.7% respectively. All the main stock market indexes closed near their intraday lows.
Turnover in both exchanges was modestly lower, enabling the broad market to dodge the label of a bearish “distribution day,” which occurs when the major indices decline on higher volume. Total volume in the NYSE edged 1% lower, while turnover in the Nasdaq was 4% lighter than the previous day’s level. In the NYSE, declining volume exceeded advancing volume by a margin of 3 to 1. The Nasdaq adv/dec volume ratio was negative by 5 to 2. Despite the significant percentage losses and negative market internals of the broad market, the lighter volume tells us that banks, mutual funds, hedge funds, and other institutions were not active participants in yesterday selling. Given that both the NYSE and Nasdaq registered a “distribution day” on August 21, we have been on the lookout for further instances of heavy volume selling. Since that didn’t happen, we consider yetserday’s selloff to be part of a healthy pullback off the highs.
Along with iShares Nasdaq Biotech ($IBB), which we are already long, the S&P Healthcare SPDR ($XLV) is one of the few industry sector ETFs showing relative strength to the main stock market indexes because it has been consolidating near its all-time high for the past four weeks. Starting with the daily chart interval, notice that $XLV has been clinging to support of its 20-day exponential moving average for the past week, even as the major indices have been pulling back off their highs over the past several days:

Zooming out to the longer-term weekly chart interval, notice that $XLV has been forming a pattern similar to a bull flag over the past three weeks. This type of price consolidation near the all-time highs should soon lead to a breakout that resumes the dominant uptrend. The weekly chart pattern is shown below:

Based on its relative strength, we are monitoring this ETF for potential buy entry in our model trading portfolio over the next few days. However, you will notice we did not yet list the trade as an “official” set up on our ETF trading watchlist. This is because we are waiting for a lower risk entry point, particularly one in which we can set a more clearly defined protective stop price. Aggressive traders may wish to take a shot at $XLV above the two-day high of $38.54, with a tight stop just below support of the 2-day low. However, given that we are not yet in a high momentum market, we prefer to first wait for some type of bullish reveral bar to form instead (as annotated on the daily chart above).
Although yesterday’s losses in the broad market were substantial, the benchmark S&P 500 Index remains above near-term support of its 20-day exponential moving average. The Nasdaq Composite has been holding up even better, as the index remains above even shorter-term support of its 10-day moving average. Overall, we consider the markets current pullback to be a healthy retracement off the highs, and will maintain that bias unless we suddenly start seeing an influx of institutional distribution. When the major indices start attempting to head back up again, the next rally could lead to a breakout to fresh multi-year highs in several of the main stock market indexes.
stock commentary:
There are no new setups for today. Although a few of our stocks held up well yesterday, the lack of follow through from the entry point on most positions is a concern. That being said, we must keep in mind that the market has been in pullback mode, so these stocks have held up well versus the broad market. Let’s see if the bulls return to the market over the next few days.
We are keeping an eye on the IBD 85/85 Index, which tracks the top small, mid, and large-cap growth stocks in the market (most of the focus in on the small and mid-caps). We’d like the price action to break out above the horizontal line along with the relative strength line. A price breakout without confirmation of a relative strength line breakout would be a red flag, as it would mean that growth stocks continue to lag the blue-chip S&P 500.

If you are a new subscriber, please e-mail [email protected] with any questions regarding our trading strategy, money management, or how to make the most out of this report.
relative strength combo watchlist:
Our Relative Strength Combo Watchlist makes it easy for subscribers to import data into their own scanning software, such as Tradestation, Interactive Brokers, and TC2000. This list is comprised of the strongest stocks (technically and fundamentally) in the market over the past six to 12 months. The scan is updated every Sunday, and this week’s RS Combo Watchlist can be downloaded by logging in to the Members Area of our web site.