Commentary:
Stocks slid on Friday as volume contracted. For the first day in almost two weeks of trading all five major averages lost ground. However, the market did close well off session lows. After being down nearly 1.5% intraday, the Nasdaq recovered and ended the session lower by only 0.5%. The small-cap Russell 2000 and the Dow Jones Industrial Average also fell 0.5% while both the S&P MidCap 500 and the S&P 500 shed 0.7%.
Friday’s market internals portrayed a mixed bias. Volume declined across the board, as turnover eased 14% on the Nasdaq and 10% on the NYSE. This is positive because it indicates institutions such as mutual funds and hedge funds were not heavily selling into the decline. Nevertheless, the adv/dec volume ratios were firmly negative, indicating the bears still had control. In the NYSE, declining volume exceeded advancing volume by a ratio of nearly 5 to 1. The Nasdaq adv/dec volume ratio was negative by approximately 2 to 1.
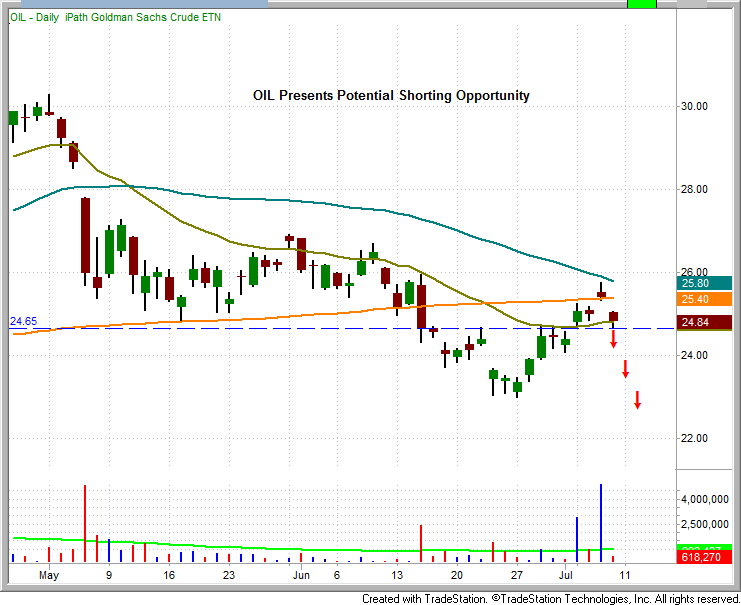
Since losing support of its 200-day MA on June 15th, the iPath Goldman Sachs Crude Oil ETN (OIL) has found resistance at this former support level. A drop below yesterday’s low of $24.67 could provide a shorting opportunity in OIL.

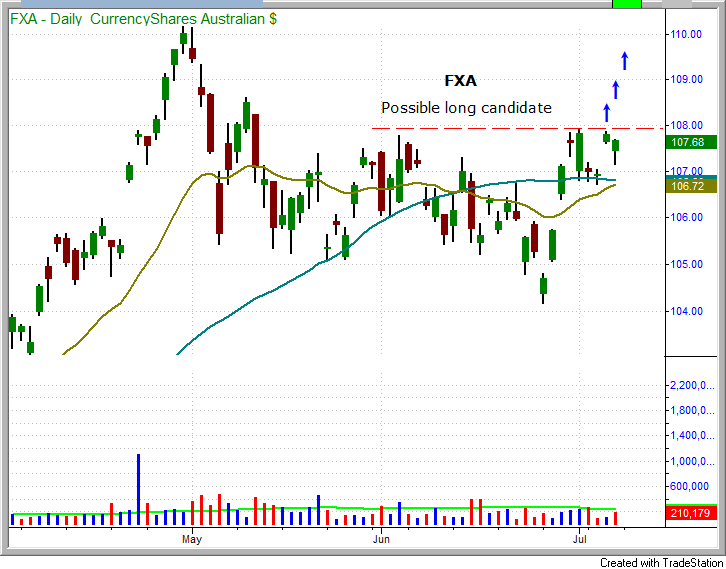
The CurrencyShares Australian Dollar ETF (FXA) has been consolidating for the past six days just below the key resistance level of $107.91. Since mid May, FXA has tested this mark on three occasions. The next test of this level could very likely result in a breakout for this ETF. We are placing FXa on the watchlist. Trade details are available to our subscribers in the watchlist segment of the newsletter.

After spending eight consecutive days of rallying back near fifty two weeks highs, it was not surprising that the market was met with selling pressure on Friday. After such an impressive advance into resistance, we would expect the market to take a “rest” and anticipate further selling early this week.
Today’s Watchlist:

FXA
Long
Shares = 250
Trigger = 108.05
Stop = 106.98
Target = 110.15
Dividend Date = n/a
Notes = See commentary above
Daily Performance Report:
Below is an overview of all open positions, as well as a performance report on all positions that were closed only since the previous day’s newsletter. Net P/L figures are based on the $50,000 Wagner Daily model account size. Changes to open positions since the previous report are listed in red text below. Please review the Wagner Daily Subscriber Guide for important, automatic rules on trigger and stop prices
- No trades were made.
- Reminder to subscribers – Intraday Trade Alerts to your e-mail and/or mobile phone are normally only sent to indicate a CHANGE to the pre-market plan that is detailed in each morning’s Wagner Daily. We sometimes send a courtesy alert just to confirm action that was already detailed in the pre-market newsletter, but this is not always the case. If no alert is received to the contrary, one should always assume we’re honoring all stops and trigger prices listed in each morning’s Wagner Daily. But whenever CHANGES to the pre-market stops or trigger prices are necessary, alerts are sent on an AS-NEEDED basis. Just a reminder of the purpose of Intraday Trade Alerts.
- For those of you whose ISPs occasionally deliver your e-mail with a delay, make sure you’re signed up to receive our free text message alerts sent to your mobile phone. This provides a great way to have redundancy on all Intraday Trade Alerts. Send your request to [email protected] if not already set up for this value-added feature we provide to subscribers.

Having trouble seeing the position summary graphic above?
Click here to view it directly on your Internet browser instead.
Notes:
Edited by Deron Wagner,
MTG Founder and
Head Trader