market timing model: BUY
Current signal generated on close of November 13.Portfolio exposure can be anywhere from 25% to 50% long. If positions are holding up well, then one can add exposure beyond 50%.Past signals:
- Neutral signal generated on close of November 6.
- Buy signal generated on close of September 9
- Neutral signal generated on close of August 15
- Buy signal generated on close of July 11
- Neutral signal generated on close of July 5
- Sell signal generated on close of June 24
today’s watchlist (potential trade entries):

Having trouble seeing the open positions graphic above? Click here to view it directly on your web browser instead.
open positions:
Below is an overview of all open positions, as well as a report on all positions that were closed only since the previous day’s newsletter. Changes to open positions since the previous report are listed in pink shaded cells below. Be sure to read the Wagner Daily subscriber guide for important, automatic rules on trade entries and exits.

Having trouble seeing the open positions graphic above? Click here to view it directly on your web browser instead.
closed positions:

Having trouble seeing the closed positions graphic above? Click here to view it directly on your web browser instead.
ETF position notes:
- No trades were made.
stock position notes:
- No trades were made.
ETF, stock, and broad market commentary:
Stocks sold off across the board, with the Dow Jones and S&P 500 once again holding up the best as they continue to trade above prior swing highs. Along with the Russell 2000, the S&P 400 and NASDAQ are also range-bound due to recent false breakouts, but all three of these averages are coming into support of the 10 and 20-day moving averages on the daily chart.
As mentioned yesterday, we have seen a dry up in actionable long setups the past few days, as many charts (from our scans) look like they could use a few weeks or so of base building before moving higher.
We discussed in yesterday’s report that $KRE failed to extend much beyond the original breakout level and may need more time to chop around.
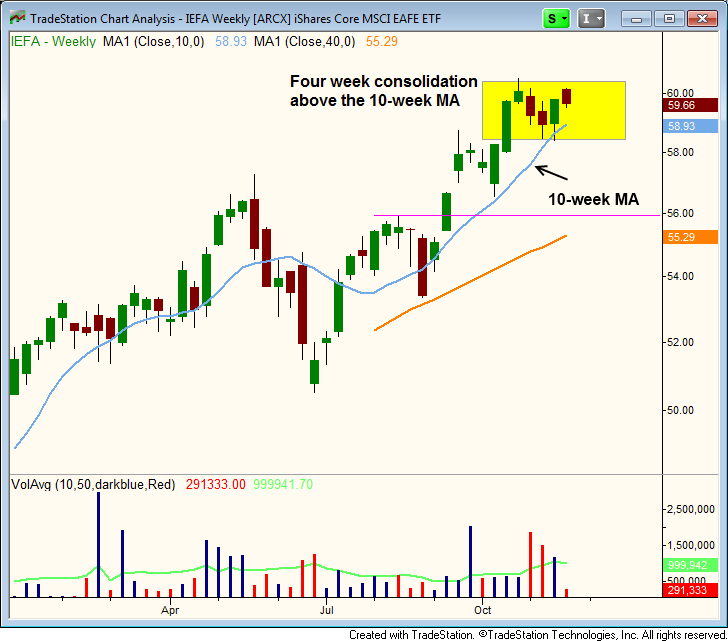
Another example of this is the weekly chart of iShares Core MSCI EAFE ($IEFA), which is in its fourth week of consolidation after stalling out around $60. One or two more weeks sideways with a test of the rising 10-week MA would be ideal price action.
One ETF that will definitely need several more weeks of base building is the Guggenheim Solar ETF ($TAN), which has seen a pick up in volatility the past few weeks after a 50% run up from its last base breakout.
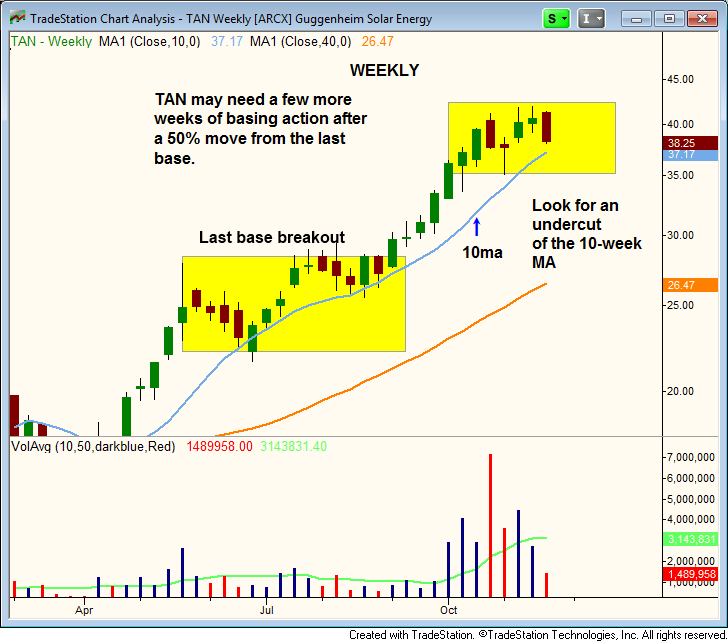
There is a bit too much interest in solar stocks right now after the strong run up. A 20% correction off the highs would not be unusual, and would put $TAN somewhere around the $33 to $34 level (as a potential base low). All stocks and ETFs eventually base out after a strong advance and $TAN is no different.
We continue to monitor the action in $TBT, as we look for a higher swing low to print or some sort of big reversal candle to signal a low risk buy entry is on place after a pullback to the 50-day MA.
Much like ETFs, there isn’t much to get excited about on the long side in our stock universe. $KORS and $MDCO are two potential pullback setups over the next few days.
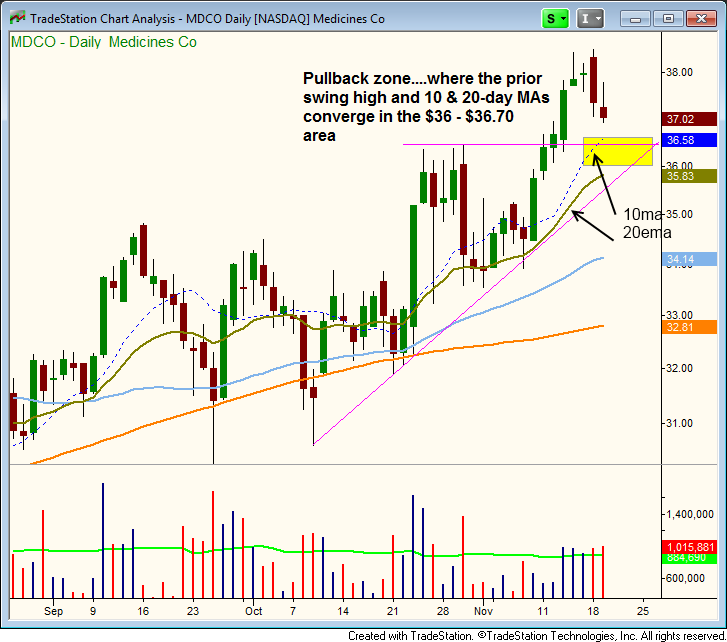
$MDCO is in pullback mode and could present us with a low risk buy entry tomorrow. There is a logical support area from $35.80 to $36.60, where the prior swing high, 10 & 20-day MAs, and a short-term uptrend line with multiple touches converge.
After three days in a row of tight price action, a move above $73.50 could produce an explosive breakout in $SSTK. Our buy setup remains live.