Current signal generated on close of June 24
Past signals:
- Neutral signal on the close of June 20
- Buy signal on the close of June 13
- Neutral signal on close of June 12
- Buy signal on the close of April 30
today’s watchlist (potential trade entries):

Having trouble seeing the open positions graphic above? Click here to view it directly on your web browser instead.
open positions:
Below is an overview of all open positions, as well as a report on all positions that were closed only since the previous day’s newsletter. Net P/L figures are based a $100,000 model portfolio. Changes to open positions since the previous report are listed in pink shaded cells below. Be sure to read the Wagner Daily subscriber guide for important, automatic rules on trade entries and exits.

Having trouble seeing the open positions graphic above? Click here to view it directly on your web browser instead.
closed positions:

Having trouble seeing the closed positions graphic above? Click here to view it directly on your web browser instead.
ETF position notes:
- $TAN entry is now a buy stop order.
stock position notes:
- No trades were made.
ETF, stock, and broad market commentary:
Stocks concluded the week with mixed results last week, as the Dow Jones Industrial Average fell 0.8% on Friday, but the Nasdaq Composite eked out a nominal gain of less than 0.1%. Volume in both exchanges rocketed higher, but was likely the result of rebalancing of the Russell 2000 Index. Turnover in the NYSE jumped 33%, while volume in the Nasdaq surged 49% above the previous day’s level.
In our most recent issue of The Wagner Daily, we said market conditions were not yet ideal for aggressively initiating new long positions, but decent performance in leading stocks were preventing us from entering short positions as well. As we enter this holiday-shortened week, the same overall sentiment remains.
Overall, “SOH mode” (sitting on hands) is probably the best bet right now for stocks and ETFs correlated to the main stock market indexes. However, one great benefit of ETFs is the ability to enter positions with a low correlation to the direction of the S&P, Nasdaq, and Dow. This group includes commodity, currency, fixed-income, and (to a lesser extent) international ETFs.
Several weeks ago, we pointed out the potential trend reversal that was shaping up in US Crude Oil Fund ($USO), an ETF that tracks the price of crude oil futures. At the time, the trade failed to trigger for buy entry, but it has held up well since then. As mentioned above, a commodity ETF like $USO is not directly affected by the day-to-day volatility of the broad market. Take a look at the weekly chart pattern of $USO:

As you can see, $USO is not yet actionable as a swing trade entry. However, we will be internally monitoring the price action of $USO over the next week for potential entry on a breakout above the resistance levels. Specifically, we are looking for a potential move above the swing high from two weeks ago ($35.06). Entering right now would be premature, as the breakout has yet to happen and the price action could chop around for several weeks more.
Guggenheim Solar ETF ($TAN) missed our pullback trigger for buy entry last Friday, as we were looking for an entry on an undercut of the previous day’s low. However, last Friday’s high in $TAN correlated to a test of the downtrend line from May 2013. As such, a breakout above that level also presents an ideal buy entry in case the pullback doesn’t come. On today’s watchlist, notice that we have changed the $TAN buy setup from a buy limit to a buy stop order (15 cents above last Friday’s high).
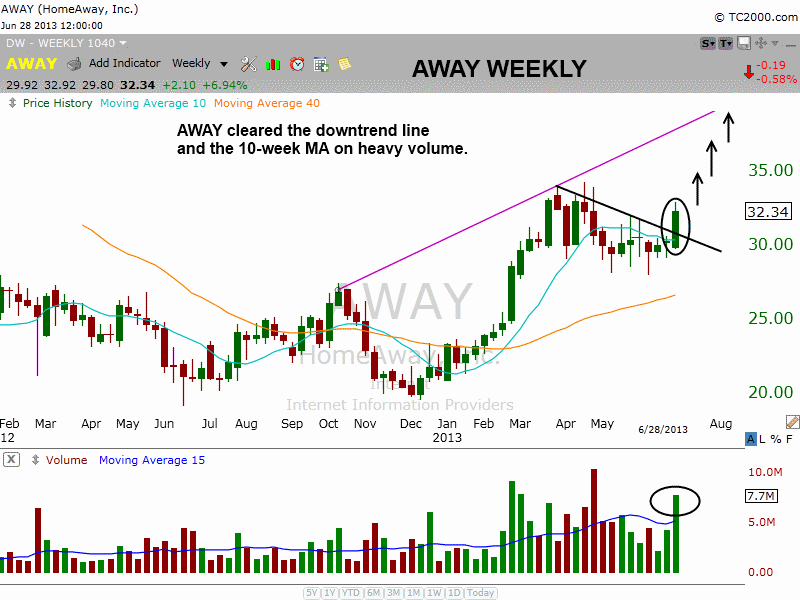
$AWAY made an impressive price and volume move last week, clearing the downtrend line and 10-day MA (the aqua colored line on the weekly chart below) on big volume. Note that the price action closed near the highs of the week, which is a bullish sign. The line that is connecting the swing highs on the weekly chart will be resistance if/when $AWAY follows through to the upside.

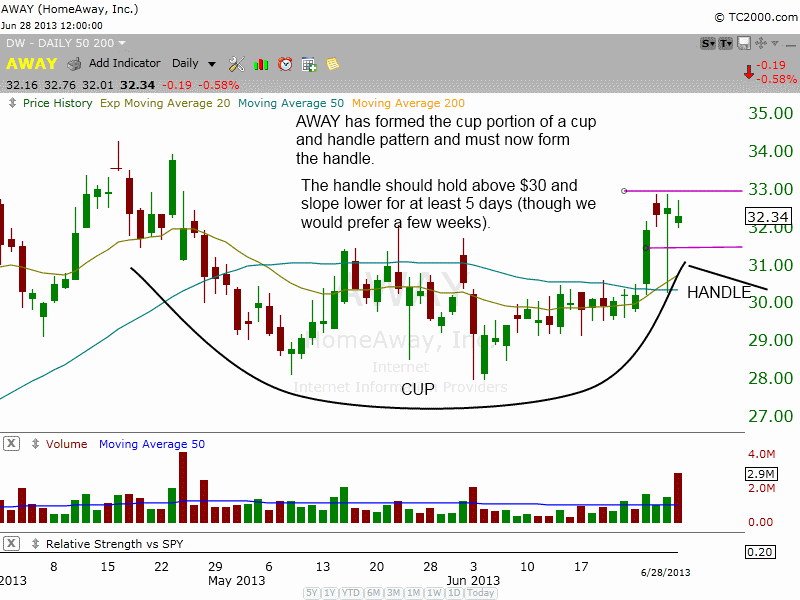
Before we get carried away with an upside target, $AWAY has a bit of work to do on the daily chart. After forming the cup portion of a cup and handle pattern the past few months, $AWAY must now form the handle. A handle is anywhere from 5 days long to several weeks. A solid handle should slope lower and volume should dry up at some point. For $AWAY, the handle should hold above the 50-day MA, which is around 30.50. Depending on how the action plays out, we might be able to add some size on a pullback to the 50-day MA, and once again on a breakout at the high of the handle.

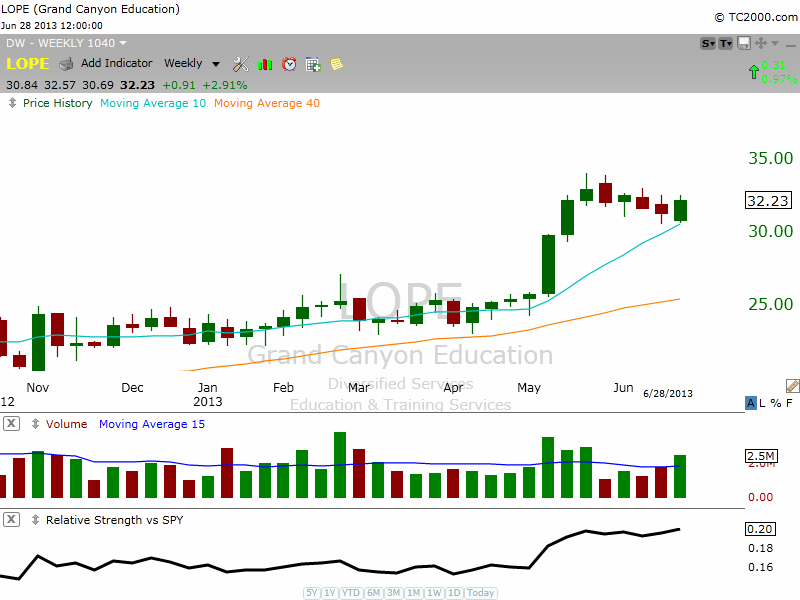
After breaking out from a long base, $LOPE is forming a flat base, which is a shallow correction of 15% or less over five or more weeks. Note the pick up in volume last week on the move up. Also, the black relative strength line, which measures the performance of $LOPE vs $SPY on the bottom of the chart below has broken out to new highs ahead of the price action. During corrections, the stocks that break out to new highs on the relative strength line ahead of price have a good chance of becoming the next leader if/when market conditions improve. Depending on how $LOPE trades this week, we may be able to locate a pullback entry with a tight stop beneath the two-week low.
