market timing model:
Sell – Signal generated on the close of October 12 (click here for more details)
today’s watchlist (potential trade entries):
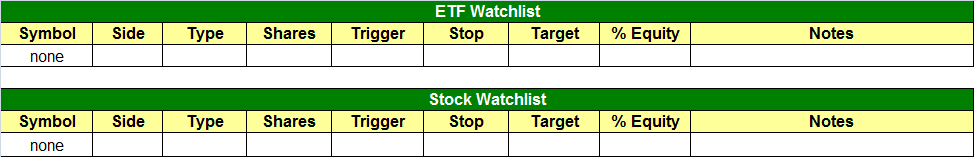
Having trouble seeing the open positions graphic above? Click here to view it directly on your web browser instead.
open positions:
Below is an overview of all open positions, as well as a report on all positions that were closed only since the previous day’s newsletter. Net P/L figures are based on two separate $50,000 model portfolios (one for ETFs and one for stocks). Changes to open positions since the previous report are listed in pink shaded cells below. Be sure to read the Wagner Daily subscriber guide for important, automatic rules on trade entries and exits.
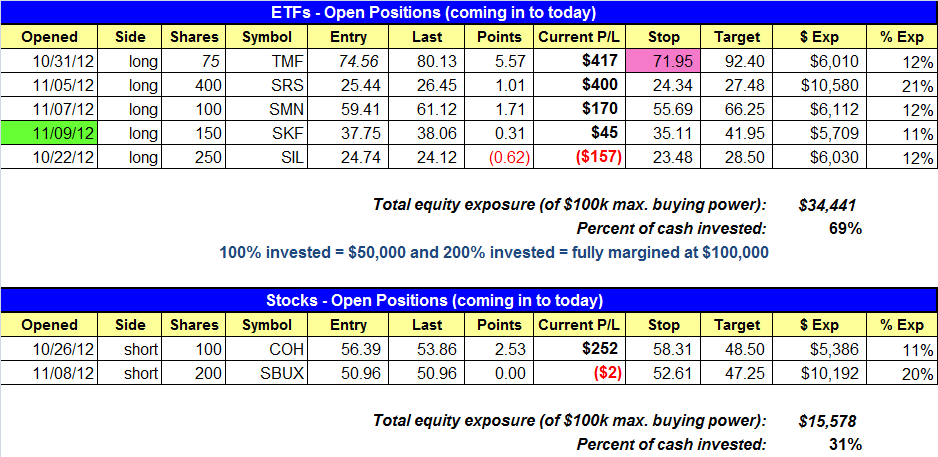
Having trouble seeing the open positions graphic above? Click here to view it directly on your web browser instead.
closed positions:

Having trouble seeing the closed positions graphic above? Click here to view it directly on your web browser instead.
ETF position notes:
- SKF hit limit price and triggered a buy entry.
stock position notes:
- No trades were made.
ETF and broad market commentary:
After two days of sharp losses, stocks managed to bounce last Friday, but the advance was unsubstantial relative to the recent decline. The Nasdaq Composite ($COMPX) eked out a gain of 0.3%, but the Dow Jones Industrial Average ($DJIA) was merely unchanged. The S&P 500 Index ($SPX), small-cap Russell 2000 Index ($RUT), and S&P Midcap 400 Index ($MID) each edged less than 0.2% higher. As of mid-day, the major indices were on pace for much larger gains (the Nasdaq was up 1.2% at its intraday high), but an afternoon selloff sent the broad market right back down. In both the NYSE and Nasdaq, total volume was 4% lighter than the previous day’s levels. This indicated a lack of institutional participation during last Friday’s rally attempt.
Less than two weeks ago, we were targeting PowerShares QQQ Trust ($QQQ), a popular ETF proxy for the Nasdaq 100 Index, for potential short sale entry if it provided us with the ideal entry point we were looking for. However, the November 1 bounce off its 200-day moving average was quite short-lived, and the Nasdaq plummeted to new lows just a few days later. But now that stocks attempted to catch a bid in the last session, it may lead to a more significant bounce off the lows this time around. If that happens, a plethora of technical overhead resistance levels will be waiting to greet any rally attempt, which could provide swing traders with new, low-risk short selling opportunities.
Now that the major indices are in a confirmed downtrend, and a bounce may be on the horizon, this is a good time to revisit the charts of QQQ. If the ETF starts to move higher in the coming week, knowing the price area where it may subsequently stall will enable us to be prepared to take advantage of a potential short sale into the broad-based index ETF.
The most basic tenet of technical analysis states that a prior level of support becomes the new level of resistance, after the support is broken (and vice versa).As such, we expect all the main stock market indexes (and their associated ETFs) to all find resistance at their 20, 50, and 200-day moving averages. Since the Nasdaq 100 (and QQQ) is the index that has exhibited the most relative weakness on the way down, this would still be the best index for a possible short sale in the near-term. Our ideal short selling entry point is shown on the daily chart of QQQ below:

Most notably, QQQ may have a rough time initially getting back above its 200-day moving average (orange line). Just above that is near-term resistance of the 20-day exponential moving average (beige line), which is now sloping sharply lower. Within the next several days, that 20-day EMA is likely to cross down below the 200-day moving average, which would be further confirmation of a bearish trend reversal.
In theory, one might expect QQQ to neatly bounce into resistance of its 200-day moving average, then start to head back down. However, technical trade setups are rarely that clean-cut and orderly, especially on the short side. A more likely scenario is that QQQ rallies back to its 200-day moving average, then “overcuts” that resistance level by 1 to 2%. That would put QQQ in the area of its prior swing highs from early November. As annotated by the dashed horizontal line, this would also correspond to a probe above the 38.2% Fibonacci retracement level (measured from the September 19 high down to the November 8 low).
If QQQ manages to rally into that highlighted target area for potential short sale, we do not immediately and blindly sell short (or buy an inverse QQQ ETF). Rather, we would then need to wait for a proper signal to sell short, such as a bearish reversal candle or sharp opening gap down. Waiting for confirmation that near-term bullish momentum has abated lowers our risk AND enables us to have a more clearly defined stop price (above the high of the bounce).
If we are fortunate enough for QQQ to provide us with the ideal, low-risk short entry point we are looking for, the first downside target would be the “swing low” of November 8. However, if bearish momentum takes QQQ back down to that low, there is a good chance the two-month-old downtrend will continue by forming another “lower low.” If that happens, increasing bearish momentum could lead to a much sharper move to the downside. The next major support is shown on the longer-term weekly chart below:

Based on the setup explained above, it is obviously too early to list QQQ as an “official” setup on today’s watchlist. However, we will be closely monitoring its price action internally, and will be sure to alert you if the setup officially gets added to our swing trading watchlist. For now, we’re just pointing out one potential scenario that could realistically happen.
Presently, we have five open ETF positions, four of which are presently showing an unrealized gain since entry. Therefore, even if the broad market fails to bounce from here and just continues lower, we are already well-positioned to profit from a further decline. Conversely, even if stocks do bounce from here, we’re not overly concerned because the “short ETF” positions we are holding have been showing relative strength to the broad market (ie. the underlying sector indexes have been showing relative weakness). Since none of our open positions have moved in our favor enough to justify taking a gain (the gain is at least double the initial risk), we are willing to hold through a pullback in our existing positions if the broad market bounces. Further, our stops are in the right place to hold through a broad market bounce, in anticipation of another leg down.
Last Friday, we entered a new trade in ProShares UltraShort Financials ($SKF). As you may recall, the setup was a pullback entry with a buy limit of $37.40. Since the exact intraday low turned out to be $37.40, we predicted the amount of the pullback rather accurately, but the problem is that most of our subscribers would have been unable to get their limit orders filled at $37.40. As such, to be fair for reporting purposes, we subsequently sent an alert later in the day that said we would be listing the official entry price as about 30 cents higher (for anybody that missed getting filled at the actual limit price). As you may have guessed, it is highly unusual for our preset limit price of a pullback trade setup to exactly correspond to the dead low of the day, so this was a rather unusual circumstance that we managed in the fairest way possible. For those who were unable to buy SKF on Friday, if it opens at or above Friday’s close you may consider still getting in but with reduced share size to lower risk. If, however, it happens to gap down to open near our entry you may consider getting in with full size (150 shares). The US Natural Gas Fund ($UNG) setup did not trigger last Friday. It has been removed from the official watchlist but we are still monitoring the action for a low risk buy point.
stock commentary:
$AAPL is such a monster stock that it has really become an index of its own. Because of this, $AAPL will probably have to undercut the prior base low before it can reverse higher and lift the Nadaq 100 along with it.

Although the market averages are sitting at short-term oversold levels and due for a bounce, that doesn’t mean our short positions can not move lower. When the market is in distribution mode and we are short stocks with bearish chart patterns, these stocks can definitely march to the bear of their own drum and sell off despite the market bouncing (like $SBUX).
There are no new setups for tonight. For experienced traders only, we do have an unofficial short setup in $BIDU. The short entry is on a break below the 11/9 low, with a fairly tight stop above the 11/8 high (short term target 95.50).
If you are a new subscriber, please e-mail [email protected] with any questions regarding our trading strategy, money management, or how to make the most out of this report.
relative strength combo watchlist:
Our Relative Strength Combo Watchlist makes it easy for subscribers to import data into their own scanning software, such as Tradestation, Interactive Brokers, and TC2000. This list is comprised of the strongest stocks (technically and fundamentally) in the market over the past six to 12 months. The scan is updated every Sunday, and this week’s RS Combo Watchlist can be downloaded by logging in to the Members Area of our web site.