Sell Mode
– Timing model generated sell signal on close of February 25 (click here for more details)
today’s watchlist (potential trade entries):

Having trouble seeing the open positions graphic above? Click here to view it directly on your web browser instead.
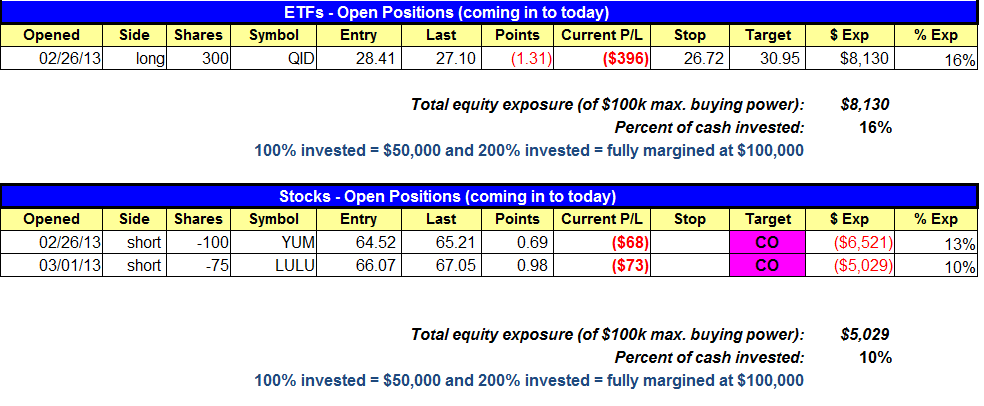
Below is an overview of all open positions, as well as a report on all positions that were closed only since the previous day’s newsletter. Net P/L figures are based on two separate $50,000 model portfolios (one for ETFs and one for stocks). Changes to open positions since the previous report are listed in pink shaded cells below. Be sure to read the Wagner Daily subscriber guide for important, automatic rules on trade entries and exits.
Having trouble seeing the open positions graphic above? Click here to view it directly on your web browser instead.
closed positions:
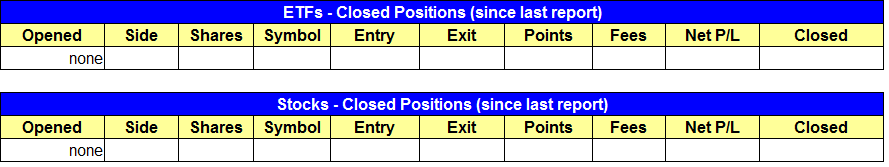
Having trouble seeing the closed positions graphic above? Click here to view it directly on your web browser instead.
ETF position notes:
- No trades were made.
stock position notes:
- CO = close trade on next day’s open.
ETF, stock, and broad market commentary:
After a chop fest of price action in the morning and early afternoon, stocks managed to get going with a strong surge in the final 90 minutes of trading. The S&P 500 rallied almost 1.0% off the lows of the session and closed at the highs of the day, up 0.5%. The same story played out on the Nasdaq Composite, as it also closed at the highs of the day with a 0.4% gain.
For the second straight day in a row, the broad based averages recovered from early weakness and closed near the highs of the day. However, as with Monday’s action, volume once again played spoiler with turnover decreasing on the NYSE and Nasdaq by 7%.
The major averages have found some traction the past few days and could potentially move to new swing highs within the next day or two. A breakout to new highs would be bullish; however, we will pass on establishing new positions until volume confirms the move. It may be tough to pass on some breakouts, but we simply can’t ignore the lack of volume.
While our weekend scans did not reveal many actionable setups, there are a few ETFs that have broken out from a longer-term base and may be setting up for a shorter-term, five week base. After breaking out above 70.00, iShares Dow Jones US Medical Devices ($IHI) rallied up to 76.00 before pulling back.

The current base is about three weeks in length and may need a few more weeks to complete. We’d like to see the price action hold above the 50-day MA or the 10-week MA on the weekly chart while basing out.
Along with $IHI, SPDR KBW Bank ($KBE) appears to be forming a short-term base after a longer-term base breakout at 25.00. $KBE also cleared a longer-term downtrend line on the breakout.

$KBE has also spent about three weeks in base mode, so a few more weeks sideways would be ideal.
On the stock side we are making a judgement call to exit short positions at the market on Wednesday’s open. Our short positions have not worked out well, so at this point we feel it’s best to step aside and limit losses. There is no need to fight the market here, as if/when the market breaks down, there should be plenty of setups to be found.
As mentioned above, we do not plan on establishing new long positions until there is some sort of volume confirmation. Although we are on a sell signal, there are mixed signals as leading stocks have not completely broken down.
For those who are willing to take the plunge on the long side (please do so w/ reduced size), $OPK is looking good, as it has formed a very tight consolidation at the highs. A move above 7.23 triggers a buy entry. A stop can be placed beneath the two-day low minus a few cents. THIS SETUP IS NOT OFFICIAL.

If you are a new subscriber, please e-mail [email protected] with any questions regarding our trading strategy, money management, or how to make the most out of this report.
relative strength combo watchlist:
Our Relative Strength Combo Watchlist makes it easy for subscribers to import data into their own scanning software, such as Tradestation, Interactive Brokers, and TC2000. This list is comprised of the strongest stocks (technically and fundamentally) in the market over the past six to 12 months. The scan is updated every Sunday, and this week’s RS Combo Watchlist can be downloaded by logging in to the Members Area of our web site.