Current signal generated on close of July 11.
Portfolio exposure should at least be 75% to 100% long or more (if you can go on margin).
Past signals:
- Neutral signal generated on close of July 5
- Sell signal generated on close of June 24
today’s watchlist (potential trade entries):

Having trouble seeing the open positions graphic above? Click here to view it directly on your web browser instead.
open positions:
Below is an overview of all open positions, as well as a report on all positions that were closed only since the previous day’s newsletter. Changes to open positions since the previous report are listed in pink shaded cells below. Be sure to read the Wagner Daily subscriber guide for important, automatic rules on trade entries and exits. Click here to learn the best way to calculate your share size.

Having trouble seeing the open positions graphic above? Click here to view it directly on your web browser instead.
closed positions:
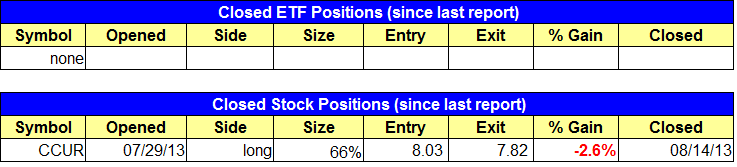
Having trouble seeing the closed positions graphic above? Click here to view it directly on your web browser instead.
ETF position notes:
- No trades were made.
stock position notes:
- $MELI, $LOCK, and $SLM buy stops triggered.
ETF, stock, and broad market commentary:
Stocks sold off across the board on Wednesday, but the losses were contained for the most part, with the lagging Dow Jones the biggest loser on the day at -0.7%. Turnover was lighter on both exchanges, so the S&P 500 and NADSAQ avoided a bearish distribution day. With the exception of the NASDAQ Composite, most averages appear to be headed for an undercut of the 20-day EMA within the next few days, which would probably scare off the weak longs. Regardless of the broad market price action, one should pay attention to individual stock and ETF action to determine the exit.
Although current market conditions are bullish, it doesn’t hurt to do a little scouting on the short side so that we are prepared if/when our timing model shifts back into sell mode. After topping out with the broad market in May, iShares Dow Jones US Real Estate ($IYR) has shown significant relative weakness to the S&P 500 over the past few months. In our analysis below, we cover the inverted ETF ProShares UltraShort Real Estate ($SRS), which is close to signaling a reversal of trend on the weekly chart below.

If $SRS can break above the prior swing high just below $25, then it will confirm the first higher swing low that was put in a few weeks ago. Also, note that the 10-week MA is now trending higher but still below the 40-week MA. If the 10ma can cross above the 40ma and hold, then this will provide more confirmation that a trend reversal is underway. While it is still too early to enter $SRS, it certainly will remain on our radar.
We have tightened up the stops on several positions (both ETFs and stocks) to lock in gains and/or limit losses. For $SLM, which just triggered, we are selling at market on the open due to the lack of follow through on our entry.
On the stock side, we sold partial size in $CCUR for a small loss and added to our position in $SLCA. There are no new setups on today’s watchlist.
Tesla Motors ($TSLA) has been a big market leader in 2013, and is currently in pullback mode after gapping to new highs on earnings. The $133 – $136 area looks to be a logical area of support, with prior resistance levels and the 20-day EMA providing support. As always, prior resistance levels that are broken to the upside become support when a stock/ETF pulls back.

We are monitoring the action for a bullish reversal candle to form within the next few days to make the setup official, provided that the price does hold at or around the 20-day EMA.