Current signal generated on close of September 9.
Portfolio long exposure can be anywhere from 30%-50% if you just joined the letter, or up to 100% (if your stocks are holding up).
Past signals:
- Neutral signal generated on close of August 15
- Buy signal generated on close of July 11
- Neutral signal generated on close of July 5
- Sell signal generated on close of June 24
today’s watchlist (potential trade entries):

Having trouble seeing the open positions graphic above? Click here to view it directly on your web browser instead.
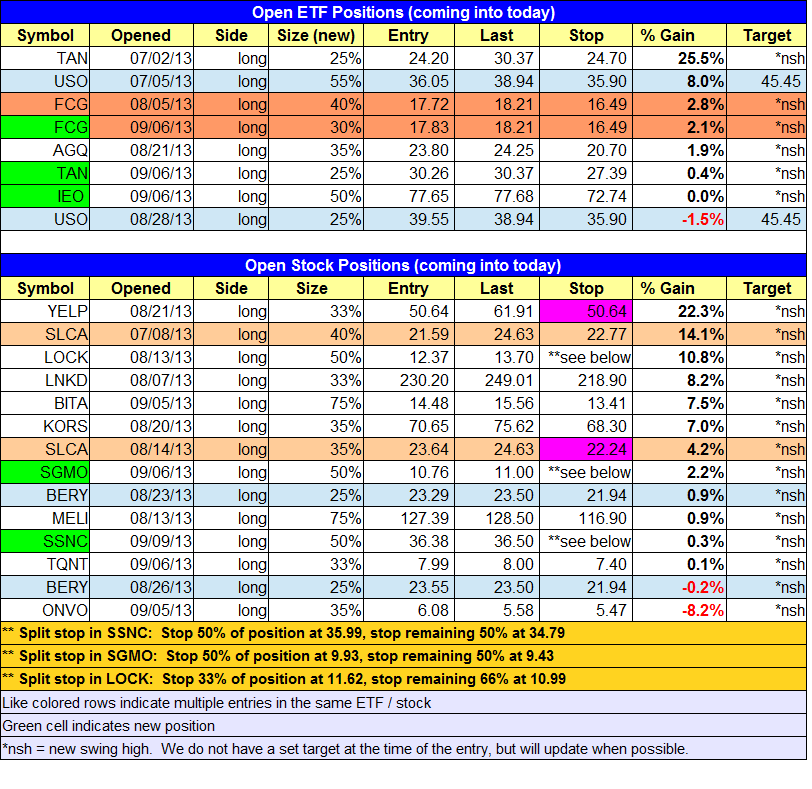
open positions:
Below is an overview of all open positions, as well as a report on all positions that were closed only since the previous day’s newsletter. Changes to open positions since the previous report are listed in pink shaded cells below. Be sure to read the Wagner Daily subscriber guide for important, automatic rules on trade entries and exits. Click here to learn the best way to calculate your share size.

Having trouble seeing the open positions graphic above? Click here to view it directly on your web browser instead.
closed positions:

Having trouble seeing the closed positions graphic above? Click here to view it directly on your web browser instead.
ETF position notes:
- No setups triggered.
stock position notes:
- $SGMO and $SSNC buy setups triggered.
ETF, stock, and broad market commentary:
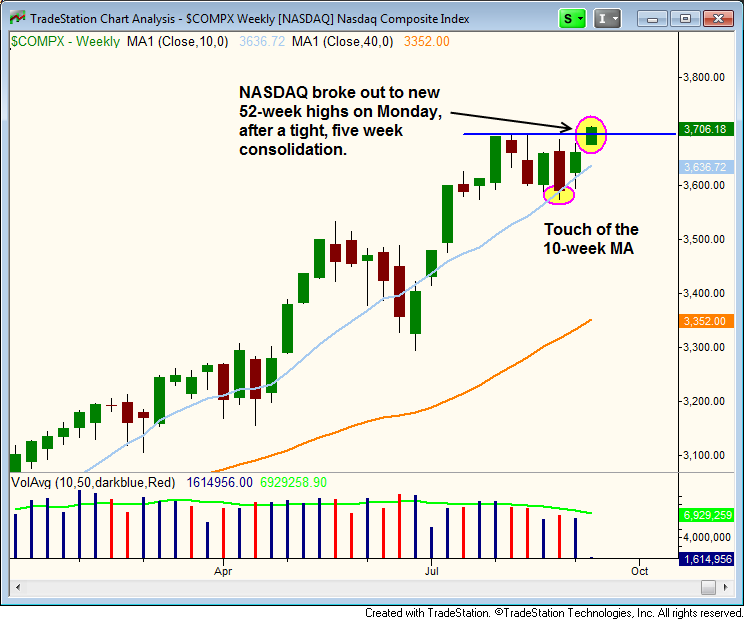
Stocks followed through on last week’s momentum with a solid performance across the board. Let by the NASDAQ’s push to new 52-week highs, all major averages closed up at least 1.0% on the day. The S&P 500, Russell 2000, and S&P 400 joined the NASDAQ Composite by reclaiming the 50-day MA. The Dow Jones is the only major average now below the 50-day MA.
Turnover was lighter on both exchanges, so the averages did not technically log an accumulation day. However, the timing model is forced into buy mode (from neutral) due to the NASDAQ Composite setting a new 52-week high. We are trend followers, so the fact that a major index is setting new highs can not be ignored. Yes, there could be a false breakout, but for now the model is in buy mode as we never argue with new highs.
With the NASDAQ moving to new highs, the weekly bull flag pattern that we mentioned last week is moving out right on schedule. If the breakout leads to a measured move, then the NASDAQ could potentially rally another 12% on the next leg up to 4,000. At the very least, the NASDAQ should be able to cover 62% of the last move up, which puts it around 3,800.

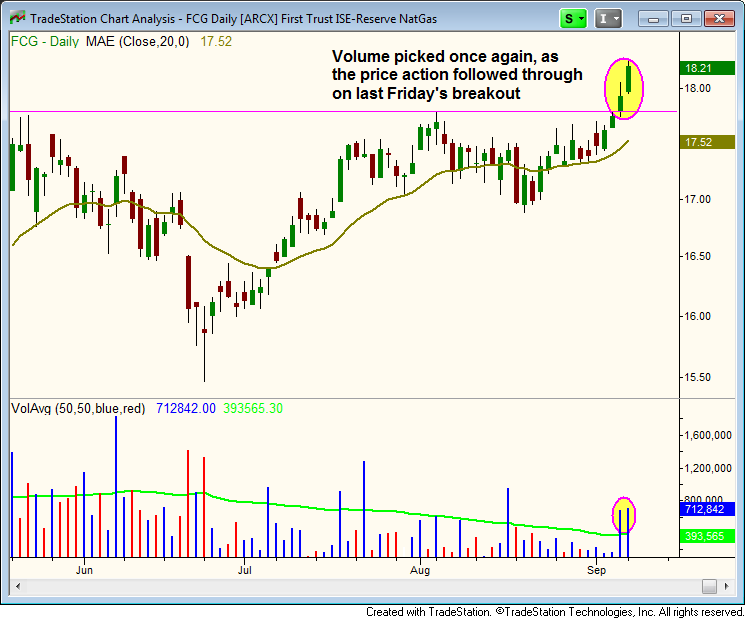
Our add in the First Trust ISE Revere Natural Gas ($FCG) last Friday is working out well, as $FCG followed through on last Friday’s breakout with another strong volume accumulation day. We look for a test of the $18.50 level within the next week or two.

$SGMO and $SSNC buy setups triggered yesterday. $SGMO followed through nicely to the upside on heavier than average volume. $SSNC printed a solid opening hour, but failed to follow through the rest of the day. Because of the lack of follow through, we are placing a tight stop below yesterday’s low on half the position.
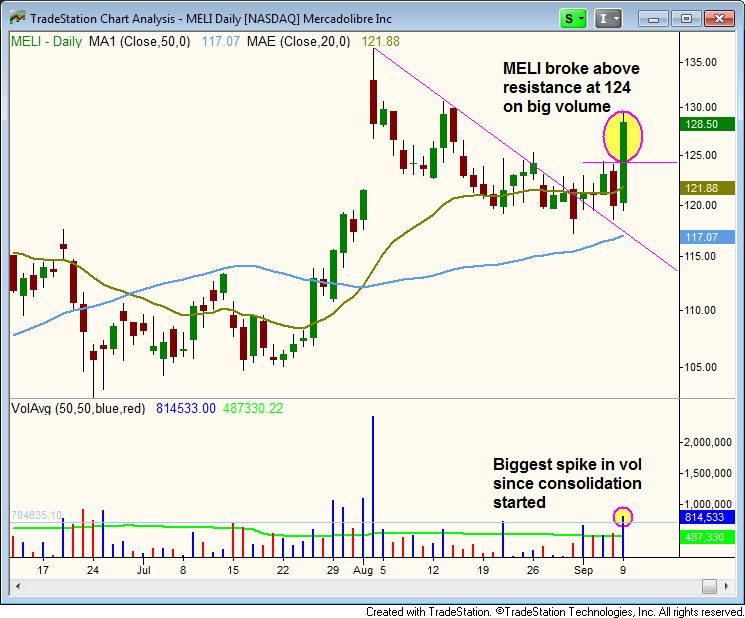
$MELI finally woke up on Monday, running 6.5% higher on the biggest spike in volume since the gap up. Looks like our patience in this setup has paid off, as $MELI could make a run at the prior highs sooner than later if the momentum holds.
