market timing model:
Buy – Signal generated on the close of August 16 (click here for more details)
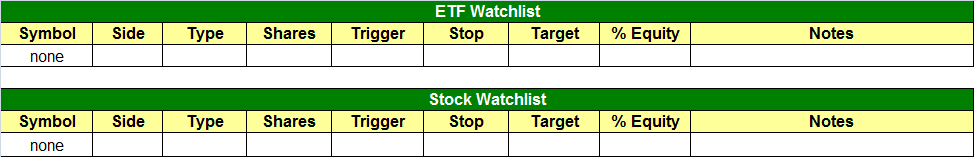
today’s watchlist (potential trade entries):
Having trouble seeing the open positions graphic above? Click here to view it directly on your web browser instead.
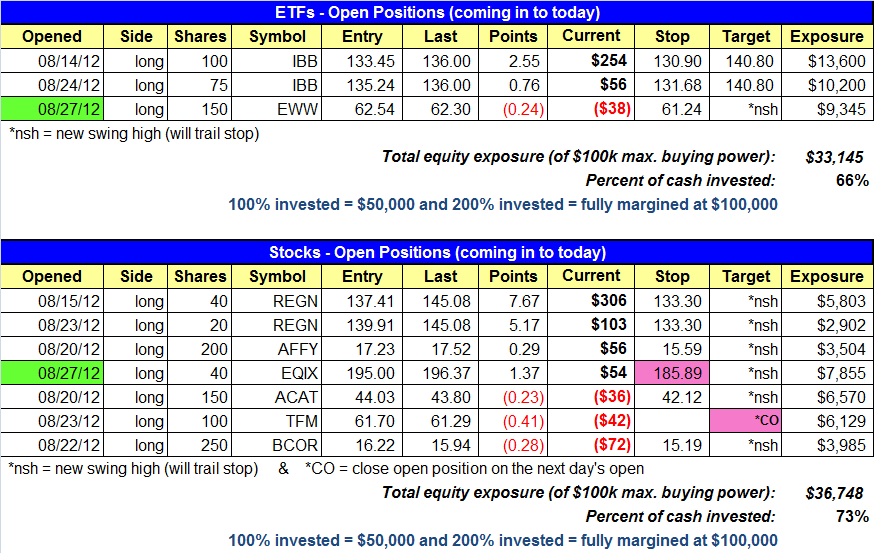
open positions:
Below is an overview of all open positions, as well as a report on all positions that were closed only since the previous day’s newsletter. Net P/L figures are based on two separate $50,000 model portfolios (one for ETFs and one for stocks). Changes to open positions since the previous report are listed in pink shaded cells below. Be sure to read the Wagner Daily subscriber guide for important, automatic rules on trade entries and exits.
Having trouble seeing the open positions graphic above? Click here to view it directly on your web browser instead.
closed positions:

Having trouble seeing the closed positions graphic above? Click here to view it directly on your web browser instead.
ETF position notes:
- EWW buy entry triggered. For those who did not enter a move above Monday’s high (plus 11 cents) is a potential entry point with the same stop.
stock position notes:
- Please note the we are selling TFM at market on Tuesday’s open because it reports earnings Wednesday morning. We would rather take a small loss than hold through earnings with no profit buffer.
- EQIX buy entry triggered. We lowered the stop price. See stock commentary below for the detailed explanation.
ETF and broad market commentary:
After gapping higher on the open, the main stock market indexes immediately reversed and surrendered their opening gains within the first half hour of trading. Buyers returned just before midday, sending stock back up to test their opening highs, but the rally attempt fizzled and the broad market drifted back down in the afternoon. The S&P 500 Index ($SPX) slipped 0.1%, while the Nasdaq Composite ($COMPQ) finished higher by 0.1%. The blue-chip Dow Jones Industrial Average ($DJIA) declined 0.3%, though it was positive that the small-cap Russell 2000 Index managed to gain 0.2%. The S&P MidCap 400 lost just 0.1%. Showing apathy into the close, the major indices finished in the bottom third to middle of their intraday ranges.
Turnover was mixed, but remained lighter than 50-day average levels in both exchanges. Total volume in the NYSE eased 4%, but volume in the Nasdaq was 3% greater than the previous day’s level. Because of the higher volume and little improvement on price, yesterday’s churning (stalling action at the highs) registered a bearish distribution day on the Nasdaq. The Nasdaq now has two distribution days on board which is fine as long as that number does not increase to 4 or 5 within the next two weeks.
Yesterday, we pointed out the swing trade setup in SPDR Gold Trust ($GLD), which we will continue monitoring for potential buy entry in the coming days. Today, we would like to bring your attention to iPath Grains ETN ($JJG), a completely different commodity ETF with a rather bullish daily chart pattern. Take a look:

Since its swift, parabolic move from mid-June to mid-July, $JJG has been forming a nice base of consolidation. It has been holding above near-term support of its 20-day exponential moving average and volume has been lighter during the consolidation as well. Last week, $JJG attempted to break out of its basing pattern and move to new highs, but it pulled back after running into resistance of its July 2012 high. With $JJG now retracing from last week’s high, this ETF may be setting up for a low-risk buy entry point within the next few days. If $JJG meets our criteria for a clearly defined buy entry point, we will added to our ETF rading watchlist as an “official” setup.
In the August 24 issue of The Wagner Daily (subscribers may log into the online archives to review it), we pointed out the relative strength in S&P Health Care SPDR ($XLV). Specifically, both the daily and weekly charts were showing tight consolidation patterns at the highs, which we anticipated would soon lead to a breakout attempt. Yesterday afternoon, $XLV probed above the high of its consolidation, but drifted back down to finish the session in the prior range. As such, the next rally above the August 27 high will be more likely to follow through to the upside. Below is an updated daily chart of the $XLV swing trading setup:

To recap what we have been analyzing for the past several days, we are presently monitoring the following ETFs for possible entry to our “official” watchlist: SPDR Gold Trust ($GLD), iPath Grains ETN ($JJG), and S&P Health Care SPDR ($XLV). One thing we like about this group of three ETFs is that two of them are commodity ETFs, and therefore have very low correlation to the direction of the overall stock market. Nevertheless, because we expect this week to be another string of very light volume days, we are not exactly thrilled about entering many more new trades ahead of the Labor Day holiday next Monday. When volume eventually returns to the market, momentum will too. With this unofficial watchlist of ETFs we are building, we will be prepared to take advantage of any sharp move in the markets (and we already have two open ETF positions as well).
stock commentary:
With yesterday’s churning, the Nasdaq has stalled on both rally attempts above the 3,080 level. The market may not be in much of a hurry to go anywhere ahead of the long weekend so we could see more choppy action the rest of the week. As long as the Nasdaq stays away from distribution (4 to 5 days) and our stocks hold up we will continue to operate on the long side of the market with confidence.
EQIX triggered the breakout entry scenario yesterday. Please not the we lowered the stop price in EQIX to just below the wide ranged reversal candle on 8/22. Why did we do this? We initially planned to go with a tight stop below the 8/24 reversal; however, upon further analysis we felt more comfortable with a stop below the big reversal candle and the 10-day moving average. The 20-day EMA will also be above our stop within the next day or two. We like our chances to ride out any false breakout with a stop below 186.00. Our risk on the trade is now around $350 which is just over half of our max $500-$600 loss.

There are no new official stock setups for today. LNKD, ONXX, CAB, FRAN, ALNY, LEN, and MDVN are a few stocks we are monitoring.
If you are a new subscriber, please e-mail [email protected] with any questions regarding our trading strategy, money management, or how to make the most out of this report.
relative strength combo watchlist:
Our Relative Strength Combo Watchlist makes it easy for subscribers to import data into their own scanning software, such as Tradestation, Interactive Brokers, and TC2000. This list is comprised of the strongest stocks (technically and fundamentally) in the market over the past six to 12 months. The scan is updated every Sunday, and this week’s RS Combo Watchlist can be downloaded by logging in to the Members Area of our web site.