Current signal generated on close of Feb. 13.
Portfolio exposure can be anywhere from 50% to 100% long (or more), depending on how open positions have held up.
Past signals:
- Sell signal generated on close of February 3.
- Neutral signal generated on close of January 24.
- Buy signal generated on close of November 13
- Buy signal generated on close of September 9
- Neutral signal generated on close of August 15
- Buy signal generated on close of July 11
- Neutral signal generated on close of July 5
- Sell signal generated on close of June 24
today’s watchlist (potential trade entries):

Having trouble seeing the open positions graphic above? Click here to view it directly on your web browser instead.
Below is an overview of all open positions, as well as a report on all positions that were closed only since the previous day’s newsletter. Changes to open positions since the previous report are listed in pink shaded cells below. Be sure to read the Wagner Daily subscriber guide for important, automatic rules on trade entries and exits.

Having trouble seeing the open positions graphic above? Click here to view it directly on your web browser instead.
closed positions:
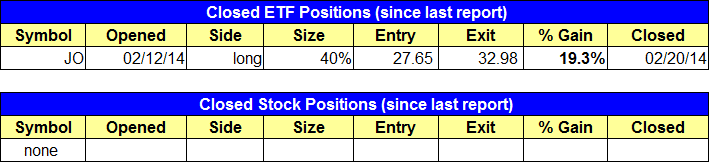
Having trouble seeing the closed positions graphic above? Click here to view it directly on your web browser instead.
ETF position notes:
- Sold $JO on the open for a 19% gain.
stock position notes:
- Canceled $KOOL buy setup due to merger. If you are long you can hold with a stop below Thursday’s low.
ETF, stock, and broad market commentary:
Stocks responded favorably to Wednesday’s distribution, led by a strong price reversal in the Russell 2000, as it rallied +1.1% and closed near the prior day’s high. The Nasdaq Composite rallied +0.7% on higher volume and the S&P 500 rallied +0.6%, but volume was lighter on the NYSE exchange.
After a sharp rally off the lows, the market is overbought in the short term; however yesterday’s action in the major averages suggests that any correction may be more by time than price. If that is the case, then we could see bull flag type patterns develop in the averages as they digest recent gains.
With two months in a row of big volume, Natural Gas ETF ($UNG) looks like it may be ready to stage a significant advance in 2014. The price action has already cleared the highs of the last base at $24, and should close above that level by the end of February to confirm the breakout on the monthly chart.

We remain long $UNG in the ETF portfolio from our January 30 entry at $23.70.
UBS E-TRACS 2x Long Wells Fargo Business Development Company ($BDCL) has been trading in a pretty tight range on the monthly chart for nearly a year, while basically setting higher lows for the most part within the base.
There has been solid support at the 10-month MA (almost like the 200-day MA) in the base, with several undercuts of the 10-month MA resulting in a bullish close well off the lows of the month.
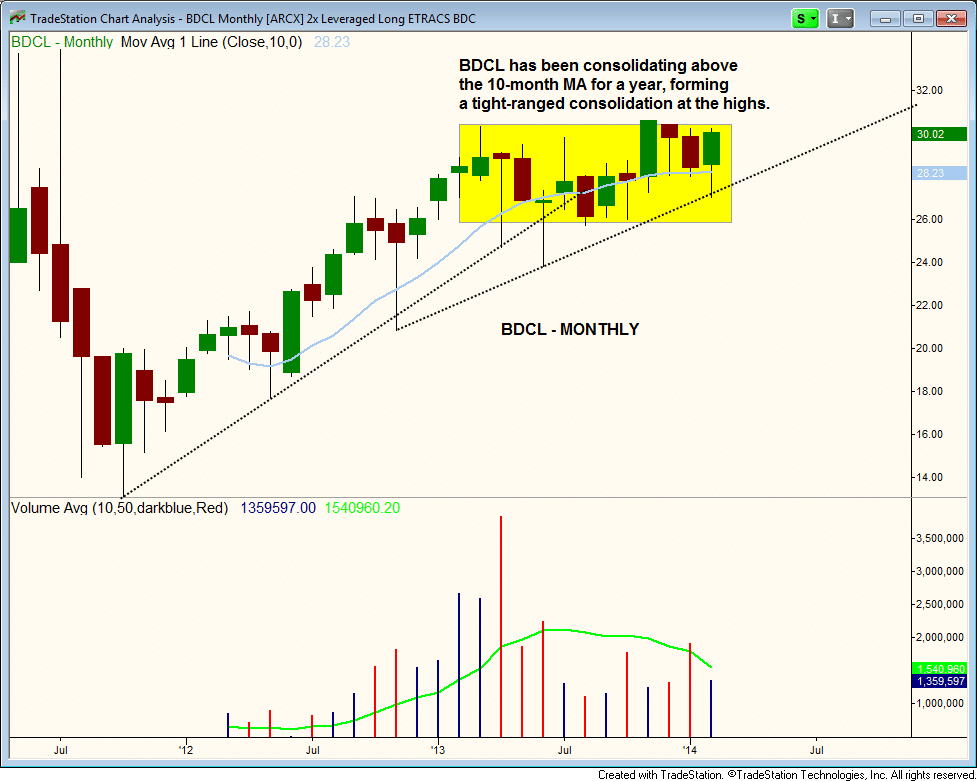
$BDCL still has much to do, as it eventually must breakout above the range highs to generate a buy signal. With shorter-term consolidations we do not mind buying ahead of the breakout. However, with consolidations of 10 months or more we prefer to wait for confirmation of a breakout before entering. See the watchlist section above for trade details.
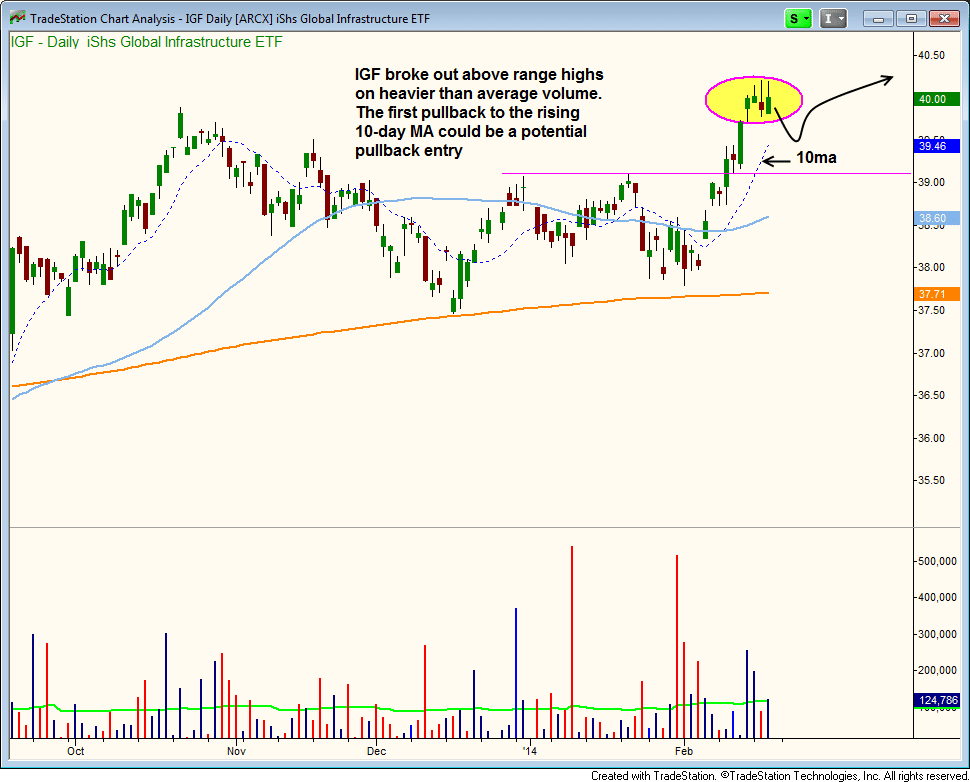
After a four-month long consolidation, iShares Global Infrastructure ($IGF) has broken out on above average volume. This is one to watch for a pullback entry somewhere around the 10-day MA if the action remains healthy. A deeper correction to the breakout pivot around $39 is a possibility if the 10-day MA does not hold.
We sold $JO at market on the open Thursday, locking in a quick 19% gain. $JO is still in good shape, and could run a few more points into the $35 – $36 area.
On the stock side, $TSLA gapped open by at least 10% from earnings. The fact that it recovered to close off the lows of the day is a good sign. There is no reason to sell right now, and as long as $TSLA holds above $180 we should be in good shape.
We have three new swing setups on today’s watchlist. All three setups are in non-A rated stocks, so we will look to sell into strength on the way up.
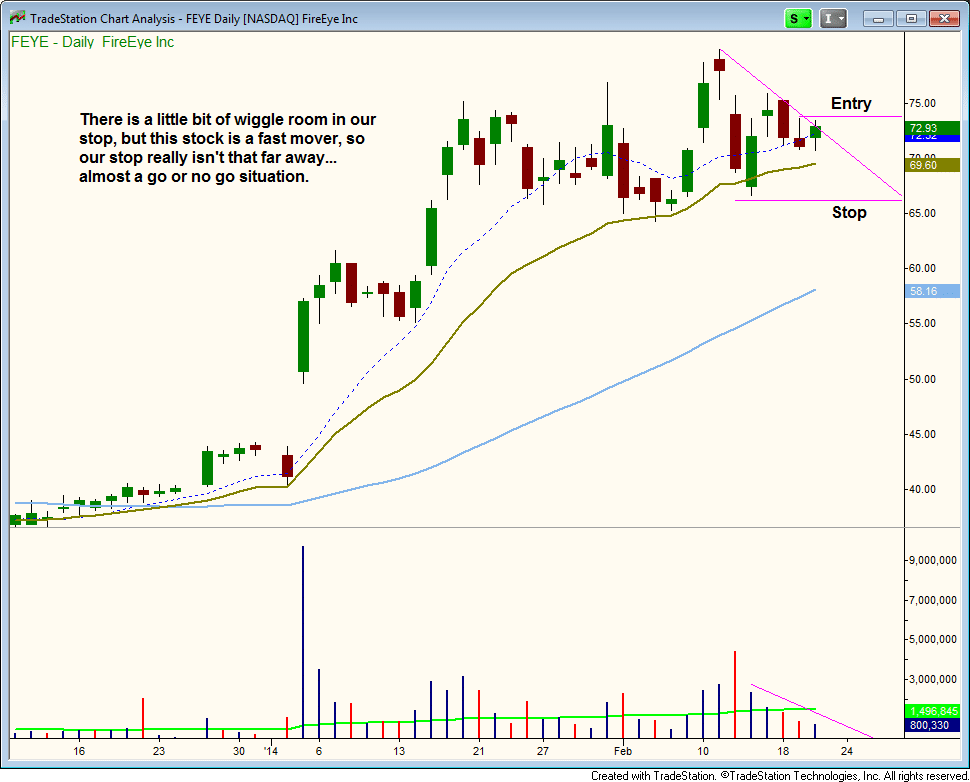
$FEYE is consolidating in a tight range after a 100% move in a few weeks. If $FEYE can hold the 20-day EMA and push higher it certainly has the potential to rip another 40-50% or more.
We like the dry up in volume the past few days is $FEYE as it attempts to digest the recent false breakout above $75.
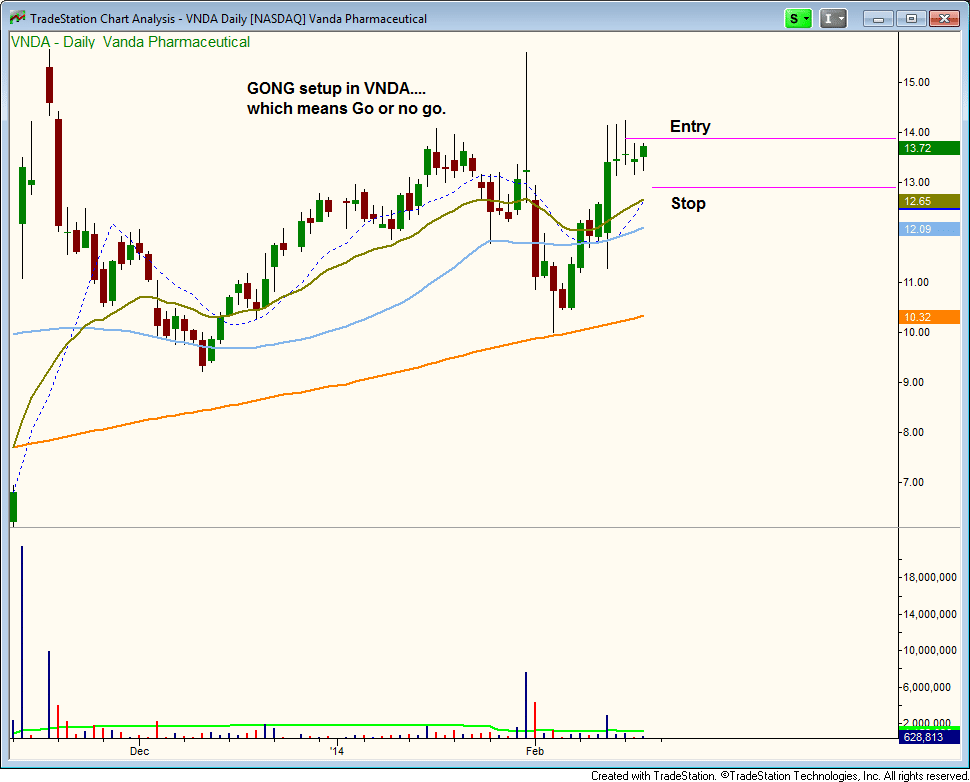
$VNDA has formed a tight range after pushing through the 50-day MA on decent volume last week. The entry is over the two-day high, with a very tight stop, so it is basically a GONG setup. We use these type of stops when the stop below a swing low is just too far away for our liking. The idea is to go with a tight stop and reduce share size. If we stop out we can take another shot if the setup still looks good.
Some traders have a problem re-entering after a stop out and stare at the action as it takes off. The key to breaking this bad habit is to focus on the present setup. If it is a valid trade, then take it!