market timing model:
Confirmed Buy – Signal generated on the close of September 4 (click here for more details) (we are on a buy signal from the close of Aug. 16)
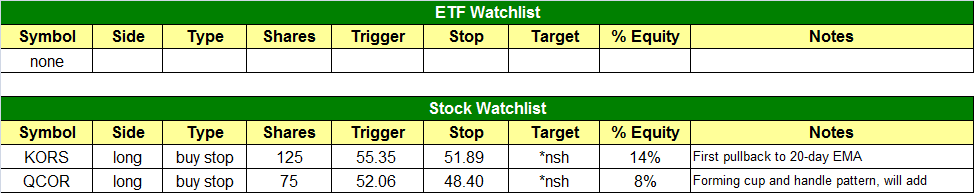
today’s watchlist (potential trade entries):
Having trouble seeing the open positions graphic above? Click here to view it directly on your web browser instead.
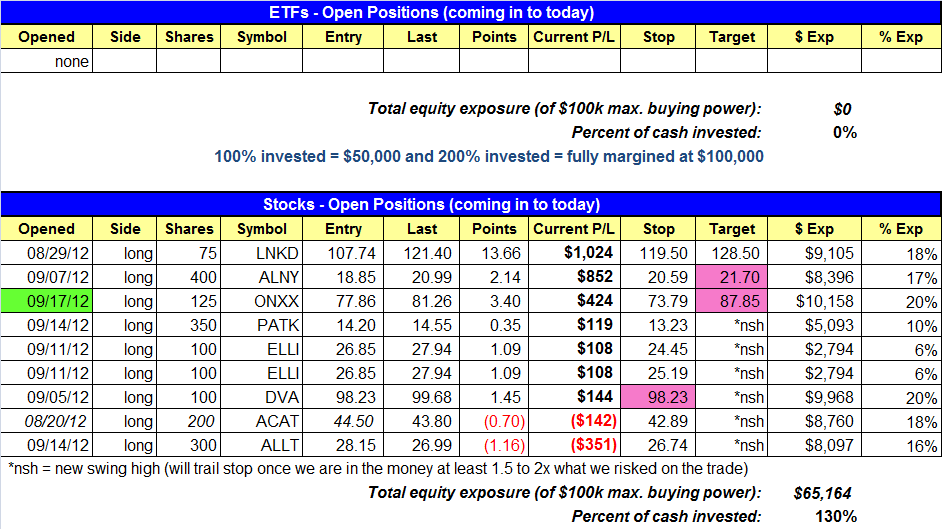
open positions:
Below is an overview of all open positions, as well as a report on all positions that were closed only since the previous day’s newsletter. Net P/L figures are based on two separate $50,000 model portfolios (one for ETFs and one for stocks). Changes to open positions since the previous report are listed in pink shaded cells below. Be sure to read the Wagner Daily subscriber guide for important, automatic rules on trade entries and exits.
Having trouble seeing the open positions graphic above? Click here to view it directly on your web browser instead.
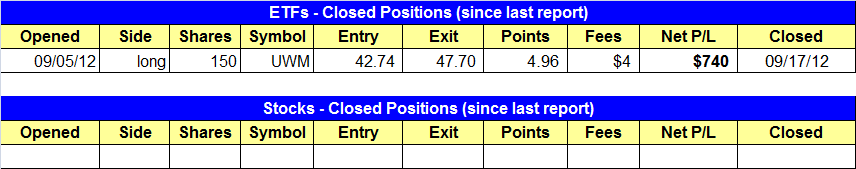
closed positions:
Having trouble seeing the closed positions graphic above? Click here to view it directly on your web browser instead.
ETF position notes:
- Sold UWM on the open and locked in a nice $740 gain. We risked about $350 on the trade, so our reward to risk ratio on the exit was a healthy 2.1 to 1.
stock position notes:
- ONXX long triggered.
- Raised the stop in ALNY to protect gains.
ETF and broad market commentary:
Stocks kicked off the week with a moderate correction from last week’s rally, as lighter volume indicated the bulls were merely taking a rest. The Nasdaq Composite ($COMPX) edged 0.2% lower. Both the S&P 500 Index ($SPX) and Dow Jones Industrial Average ($DJIA) dipped 0.3%. The small-cap Russell 2000 ($RUT) and S&P MidCap 400 ($MID) indices lost 0.7% and 1.1% respectively. Although the percentage losses in the small and mid-cap stocks were larger than the rest of the broad market, bear in mind that small and mid-caps also outperformed within the broad market last week. The main stock market indexes closed near the middle of their relatively tight intraday trading ranges.
Turnover in both exchanges fell significantly, which was a positive sign that institutional traders were not active participants in yesterday’s selling pressure. Total volume in the NYSE was 28% lighter than the previous day’s level, while volume in the Nasdaq similarly receded 26%. Across the board, trading also fell back below 50-day average levels. In the Nasdaq, declining volume exceeded advancing volume by a margin of approximately 2 to 1. The NYSE ADV/DEC volume ratio was just fractionally more negative.
In yesterday’s commentary, we said there is currently a lack of new ETF trade setups with low-risk entry points at current levels, but that we were continuing to build an increasing list of ETFs with relative strength to be considered for potential swing trade entry when the stock market pulls back or enters into a new base of consolidation. The moderate decline in yesterday’s session was a good start that caused most ETFs to retrace from their recent highs, but the pullback was not yet substantial enough to cause any individual ETFs on our radar screen to form low-risk entry points for swing trading. However, we continue building to that list with new potential trade setups. Today, we look at the buy setup in Rogers International Commodity Index ETF ($RJA).
After forming a two-month base of consolidation near its 52-week high, RJA sold off sharply yesterday to close right at key intermediate-term support of its 50-day moving average. Because it was the first touch of the 50-day moving average since breaking out from its lows three months ago, odds are good that RJA will soon move back up, break out of its consolidation, and cruise to a new 52-week high. However, in order to more clearly define our reward to risk ratio and to assist in setting our stop price, we are now looking for a possible reversal candle to form and an “undercut” below the 50-day moving average. If that occurs, we will likely add RJS to our “official” watchlist for potential buy entry. The hypothetical, ideal price action is annotated on the daily chart of RJA below:

As analyzed thoroughly in yesterday’s newsletter, we are now monitoring Regional Banks SPDR ($KRE) for possible swing trade entry. As anticipated, it sold off a bit yesterday, but has not yet retraced to the level where we would to find it to be an ideal entry point. Additionally, iShares Hong Kong Index ($EWH) is an international ETF we have been stalking for potential buy entry on a pullback. If RJA forms a pattern similar to the price action annotated on the chart above, will be looking to enter it as well.
Yesterday, we sold ProShares Ultra Russell 2000 ($UWM) for a gain of approximately 9% with a holding period of less than two weeks. Now, we are flat in the ETF portfolio, but are actively looking to assume additional risk exposure as the best technical trading setups present themselves with low-risk entry points.
stock commentary:
Although the market is extended in the short term we will continue to trade setups as they develop. We have two new setups on today’s watchlist in KORS and QCOR. QCOR is forming the handle portion of a cup and handle pattern and our entry is over the four day high. KORS has pulled back to the 20-day EMA for the first time after a big breakout. We look for support to hold here and the uptrend to resume within the next few days.

ONXX broke out to new highs on explosive price and volume action yesterday and should run 10-20% higher over the next few weeks. We raised the stop in ALNY to lock in gains rather than sit through a potential pullback.
If you are a new subscriber, please e-mail [email protected] with any questions regarding our trading strategy, money management, or how to make the most out of this report.
relative strength combo watchlist:
Our Relative Strength Combo Watchlist makes it easy for subscribers to import data into their own scanning software, such as Tradestation, Interactive Brokers, and TC2000. This list is comprised of the strongest stocks (technically and fundamentally) in the market over the past six to 12 months. The scan is updated every Sunday, and this week’s RS Combo Watchlist can be downloaded by logging in to the Members Area of our web site.