Current signal generated on close of July 11
Past signals:
- Neutral signal generated on close of July 5
- Sell signal generated on close of June 24
today’s watchlist (potential trade entries):

Having trouble seeing the open positions graphic above? Click here to view it directly on your web browser instead.
open positions:
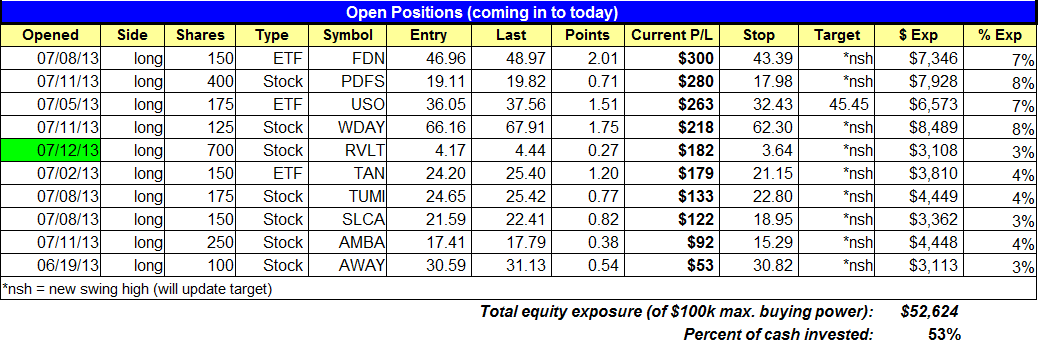
Below is an overview of all open positions, as well as a report on all positions that were closed only since the previous day’s newsletter. Net P/L figures are based a $100,000 model portfolio. Changes to open positions since the previous report are listed in pink shaded cells below. Be sure to read the Wagner Daily subscriber guide for important, automatic rules on trade entries and exits.

Having trouble seeing the open positions graphic above? Click here to view it directly on your web browser instead.
closed positions:

Having trouble seeing the closed positions graphic above? Click here to view it directly on your web browser instead.
ETF position notes:
- Please note that we are buying $SMH “at the market” on Monday’s open (do not wait for 5-minutes).
stock position notes:
- $RVLT buy entry triggered. If the 5-minute rule applies to $MNKD trigger, we will use the 5-minute high plus 1 cent as the official entry.
ETF, stock, and broad market commentary:
Stocks closed a positive week on the bullish note last Friday, as the major indices continued building on the recent gains. Although the Dow Jones Industrial Average was unchanged for the day, the tech-heavy Nasdaq Composite climbed 0.6%. The benchmark S&P 500 Index rose 0.3%. Both the S&P and Dow scored new ALL-TIME closing highs, while the Nasdaq closed at its highest level since the year 2000.
Unfortunately for the bulls, total volume in both exchanges was lighter than the previous day’s levels. Turnover in the NYSE these 10%, while trade in the NASDAQ was 12% lighter. This means that last Friday’s advance was more the result of a lack of selling, as opposed to institutional buying interest.
In last Friday’s (July 12) newsletter, we pointed out in detail the potential by setup in a popular semiconductor ETF ($SMH). Specifically, we pointed out that $SMH had broken out above near-term resistance on the daily chart, as well as above long-term resistance on its weekly chart.
After the July 11 breakout, we wanted to wait for additional confirmation that the breakout was going to hold before before buying it. When a trade setup is based on a weekly chart timeframe, we simply look for a weekly closing price above resistance of the breakout.
Since the price closed above resistance of the breakout level on the weekly chart last Friday, $SMH is NOW an ideal intermediate-term ETF trade candidate. Because of this, subscribing members should note our specific entry, stop, and target prices for this SMH trade setup on today’s watchlist:

A lot of false breakouts occur on the daily chart patterns of stocks and ETFs, but the WEEKLY chart pattern breakouts are much more reliable and usually lead to longer uptrends (before the inevitable correction comes).
On the stock side, $RVLT triggered its buy entry on Friday. Per our intraday alert on the open, we waived the 5-minute rule and bought $RVLT just after the open since it had already cleared and held above the breakout level at $4 on Thursday.
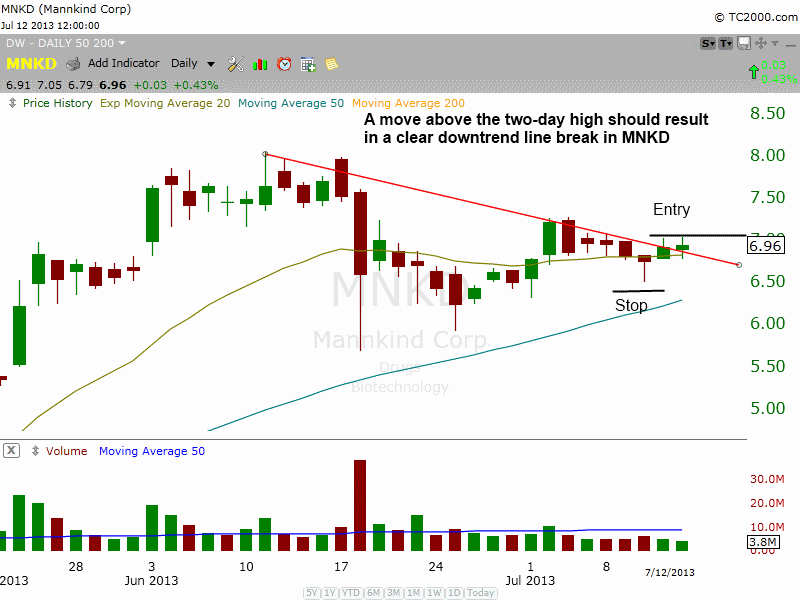
We have one new buy setup on the stock side in $MNKD – MannKind Corporation. $MNKD is forming a bullish consolidation above the rising 50-day MA, and its relative strength ranking of 99 is tops in a biotech group with over 250 stocks. The 20 EMA is above the 50 MA, and the 50 MA is above the 200 MA, so the chart is in a very strong uptrend. Our buy entry is over the two-day high, which should produce a clear break of the downtrend line. If the price and volume action is strong on the breakout, then we might be able to hold for a move to the 9.00 – 9.50 resistance level on the weekly chart. But for now our target is simply *nsh, which means new swing high (we will update price as soon as possible).
Note: If the 5-minute rule applies to $MNKD on the trigger, then we will place a new buy stop 1 cent above the 5-minute high (going 10 cents above the high is too much on a $7 stock).
