Confirmed Buy– The timing model was upgraded to a confirmed buy on the close of January 22. However, the initial buy signal was generated on the close of December 31. (click here for more details)
today’s watchlist (potential trade entries):

Having trouble seeing the open positions graphic above? Click here to view it directly on your web browser instead.
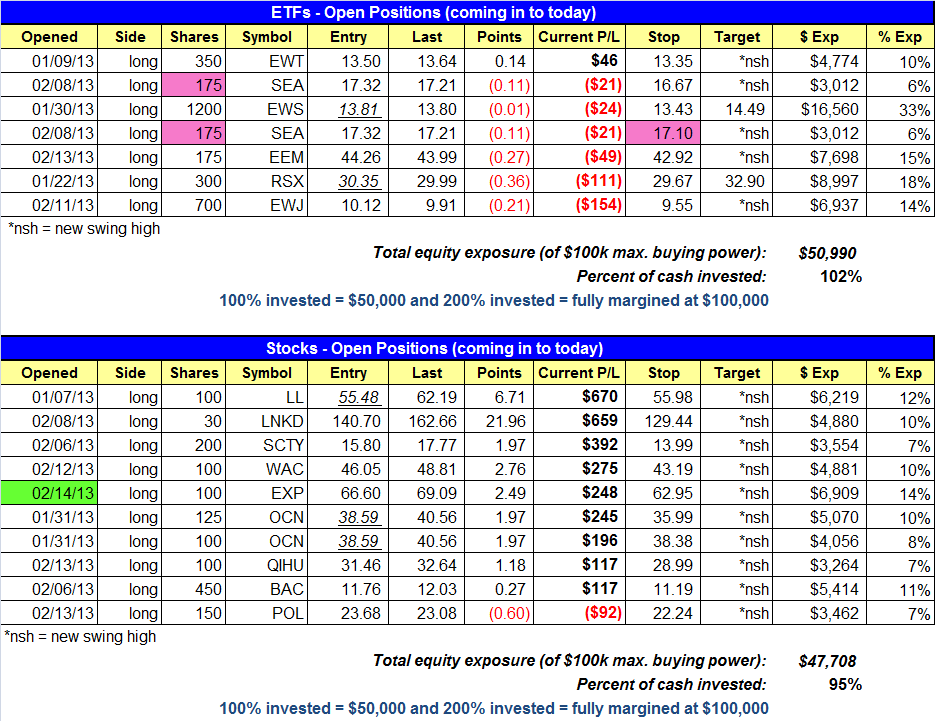
open positions:
Below is an overview of all open positions, as well as a report on all positions that were closed only since the previous day’s newsletter. Net P/L figures are based on two separate $50,000 model portfolios (one for ETFs and one for stocks). Changes to open positions since the previous report are listed in pink shaded cells below. Be sure to read the Wagner Daily subscriber guide for important, automatic rules on trade entries and exits.
Having trouble seeing the open positions graphic above? Click here to view it directly on your web browser instead.
closed positions:
Having trouble seeing the closed positions graphic above? Click here to view it directly on your web browser instead.
ETF position notes:
- Raised the stop in $SEA on half the position in case it fails to set higher lows.
stock position notes:
- No trades were made.
ETF, stock, and broad market commentary:
A late afternoon rally in the S&P 500 allowed the index to close well off the lows of the session, and more importantly, avoid distribution by closing down only -0.1%. Turnover increased on the NYSE, so had the S&P 500 closed at the lows of the day (down 0.3% to 0.4%) it would have registered a bearish distribution day.
During any strong advance, there will always be a few shakeouts along the way. We know from experience that it is never easy to stay long when the market is extended. This is why we focus on individual setups and the distribution count (of major averages) to gauge the health of the rally. Trade what you see, not what you think!
The Claymore/MAC Global Solar Index ($TAN) broke out from a tight, month long base last week.

The breakout was confirmed by a weekly close above 19.60, as well a big pick up in volume.
On the daily chart, we are looking for a slight pullback to 19.60 as a buy entry using a buy-limit order. If $TAN does pull back in, then we would view the action as constructive as long as it holds above the 20-day EMA. The stop is placed beneath the lows of the range. A stop placed any higher would run the risk of choking the trade off, as $TAN does trade with more volatility than most non-leveraged ETFs.

After several months of base building, the iShares MSCI Taiwan Index ($EWT) has formed a tight trading range on the weekly chart.

Note the tight range on the weekly chart over the past 10-weeks. Whether we are looking at a monthly, weekly, or even intraday chart, the basic idea is to see a tightening of the price action above or around major moving averages.
Ideally, we’d like to see $EWT pull back in one more time and test the 13.0 – 13.60 level. We plan on adding to our existing position if $EWT can clear 13.80 on a pick up in volume.

On the stock side, $LL report earnings on Feb. 20. We plan to hold through earnings, as we have a great profit buffer and the market is in good shape. Those who do not wish to hold through earnings cab take profits on Tuesday’s open.
$POL failed the recent breakout, but should be ok as long as it holds above the 20-day EMA. We will look to add to our position in $BAC if it can form some sort of bullish reversal bar within the next few days.
We are monitoring the price action in $WDC for a potential breakout entry. After breaking out to new highs a few weeks ago, the price action stalled out and has formed a tight range above the highs of the prior base.

Dropping down to the daily chart, we’d like to see one more shakeout in $WDC to form another high swing low within the base. The setup is not actionable without this pullback or further consolidation of some sort.

If you are a new subscriber, please e-mail [email protected] with any questions regarding our trading strategy, money management, or how to make the most out of this report.
relative strength combo watchlist:
Our Relative Strength Combo Watchlist makes it easy for subscribers to import data into their own scanning software, such as Tradestation, Interactive Brokers, and TC2000. This list is comprised of the strongest stocks (technically and fundamentally) in the market over the past six to 12 months. The scan is updated every Sunday, and this week’s RS Combo Watchlist can be downloaded by logging in to the Members Area of our web site.