Commentary:
Stocks surged higher across the board on Tuesday on strong trade. All five major indices closed well in the black, with large cap issues leading the advance. By the closing bell the Nasdaq, S&P 500 and the Dow Jones Industrial Average posted gains of 1.7%, 1.6% and 1.5% respectively. The small-cap Russell 2000 also tacked on 1.5%, while the S&P MidCap 400 gained the least, at 1.0%.
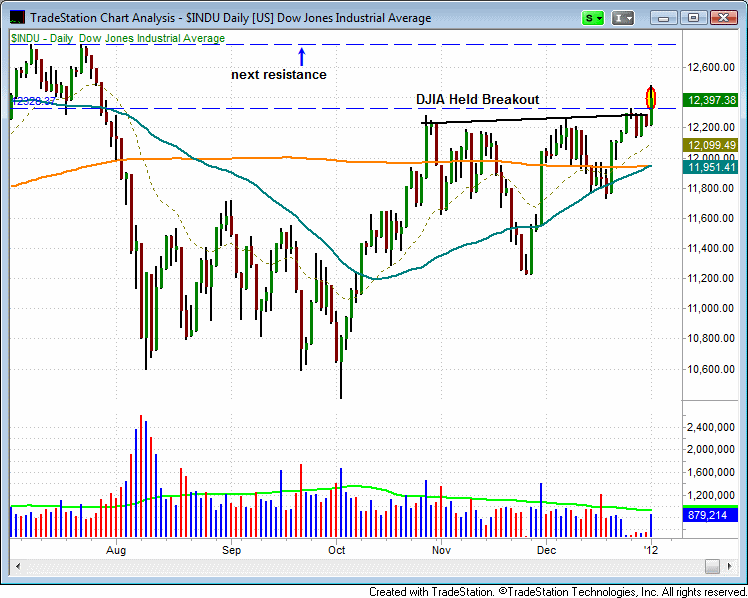
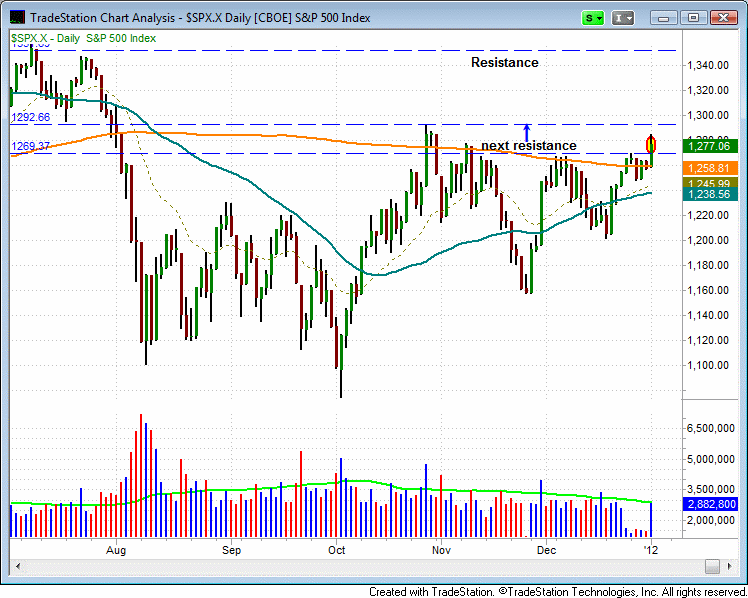
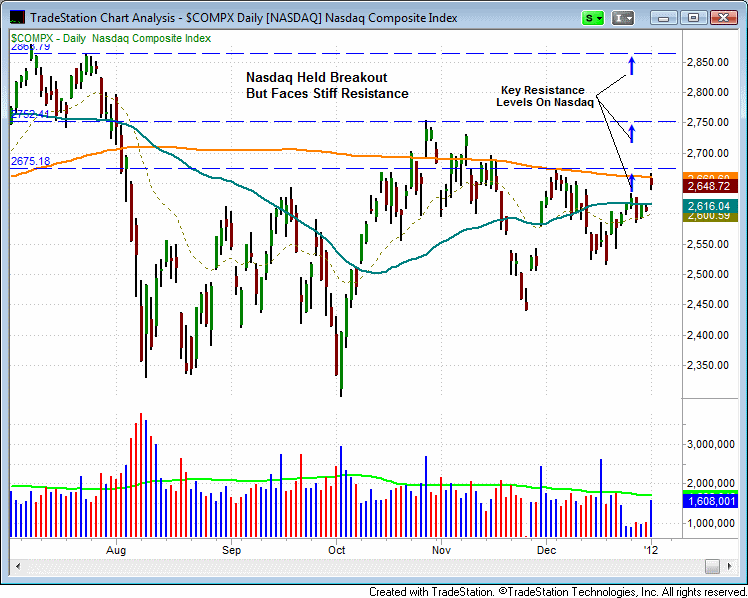
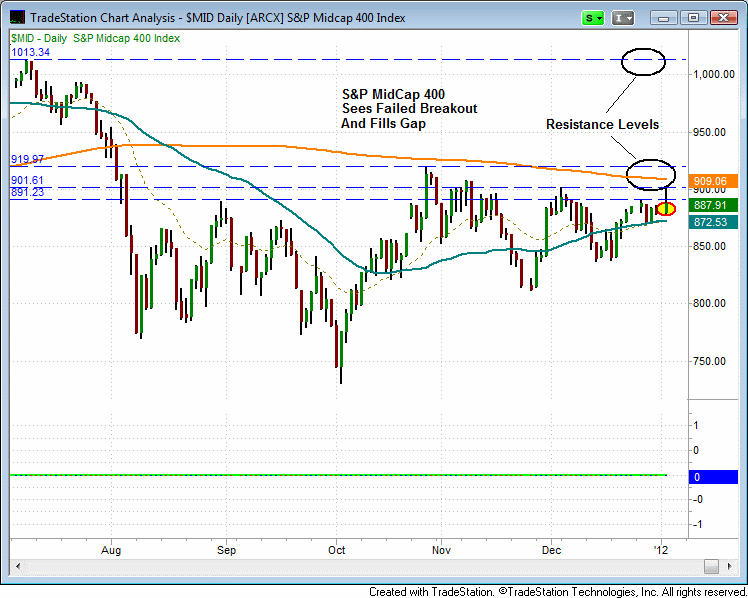
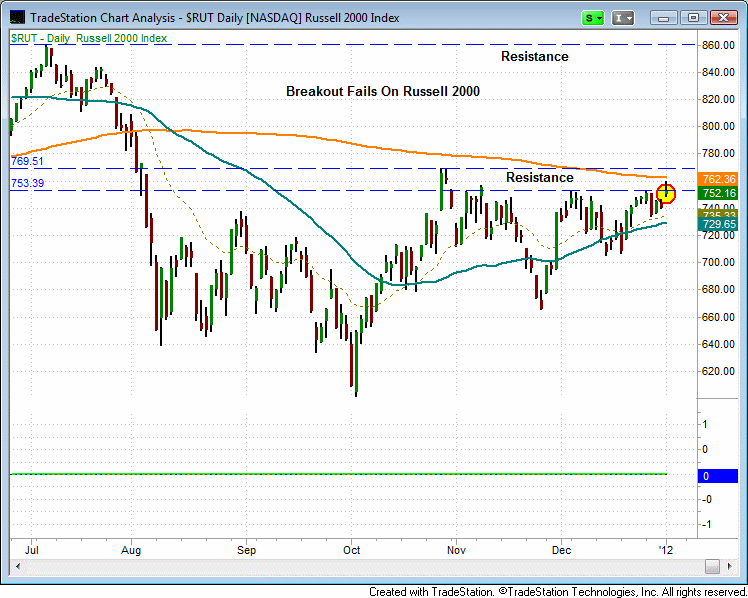
Market internals were positive on both exchanges yesterday. As might be expected in the first post-holiday session, volume was significantly higher across the board. However, turnover was still below the 50-day moving average on both exchanges. Volume ended the session up by 57.0% on the Nasdaq and 58.0% on the NYSE. Advancing volume was higher than declining volume by 4 to 1 on the NYSE and 5 to 1 on the Nasdaq. It’s probably safe to conclude that Tuesday was an accumulation day for the big cap indices but the picture is not as clear for mid and small cap issues. Basically, the majority of Tuesday’s gains were a result of the gap up and not intra-day price action. The DJIA, S&P 500 and Nasdaq all broke out above recent trading ranges and held the gap (Albeit, they closed near intraday trading lows). However, both the Russell 2000 and the S&P MidCap 400 fell back into their respective trading ranges, with the mid-cap index filling its gap.
The charts below provide an excellent visual of the key resistance levels now facing the major indices. Notice that the DJIA is showing the most strength and faces the least resistance as it rallies to the highs set last summer. However, the Nasdaq, Russell 2000 and S&P MidCap 400 indices face formidable resistance between current levels and the highs of last year.
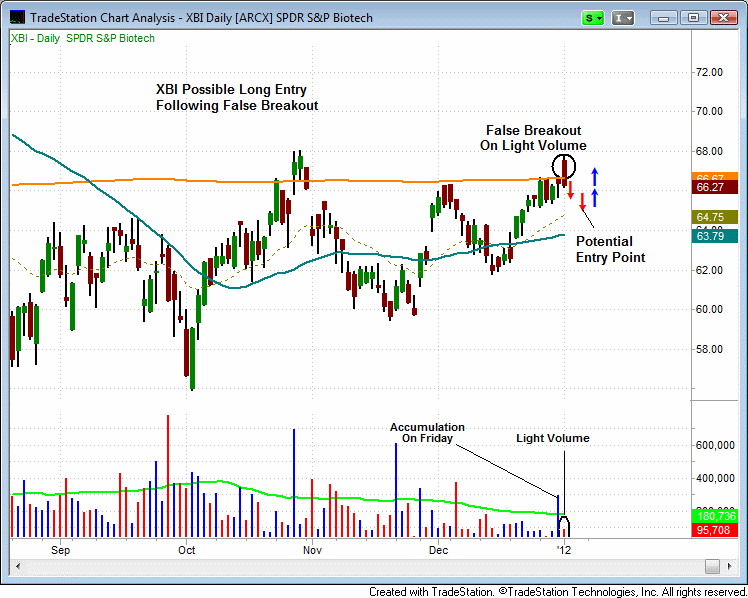
December 30th, the SPDR S&P Biotech ETF (XBI) formed a reversal candle as it reversed off of intraday lows, on high volume, to close just below the 200-day MA. Then yesterday, on very light volume, XBI printed a false breakout above the 200-day day MA. However, yesterday’s light volume selloff could bode well for a long entry in this ETF. Often, after an obvious breakout level fails, an ETF will undercut a previous swing low and provide a more reliable setup. False breakouts serve to sweep stops and shake any weak hands out of the trade. The ensuing rally is the one that ends up driving the ETF to higher ground.
IYT gapped up yesterday and broke above the five minute high, so we entered the trade. However, it then spent the remainder of the session in a tailspin as it nearly filled the morning gap. We are raising the stop in IYT to just below the December 28th low. The new stop is $88.10. EUO gapped down yesterday but is holding support above the 20-day moving average, and remains well above its stop. IYZ broke out on a massive spike in volume yesterday and appears likely to move higher. Both BZQ and FXP are being removed from the watchlist, as both setups have been rendered invalid. XRT remains on the watchlist. However, please note that that new trigger, stop, and share size have been posted in the watchlist for XRT.
Although the major indices saw significant gains yesterday, the intraday price action was mixed. Many stocks opened near the highs and closed at the lows of the session. Further, it was primarily a day of bottom fishing as the worst performing industry groups performed the best. The lowest of the low, solar energy, saw the biggest gains on the session. Resource related sectors also performed well, despite being some of the poorest performers for months. Nonetheless, since three of the five major indices gapped up and held the gap, a bullish follow through day over the next several sessions could spark a big rally.
Today’s Watchlist:
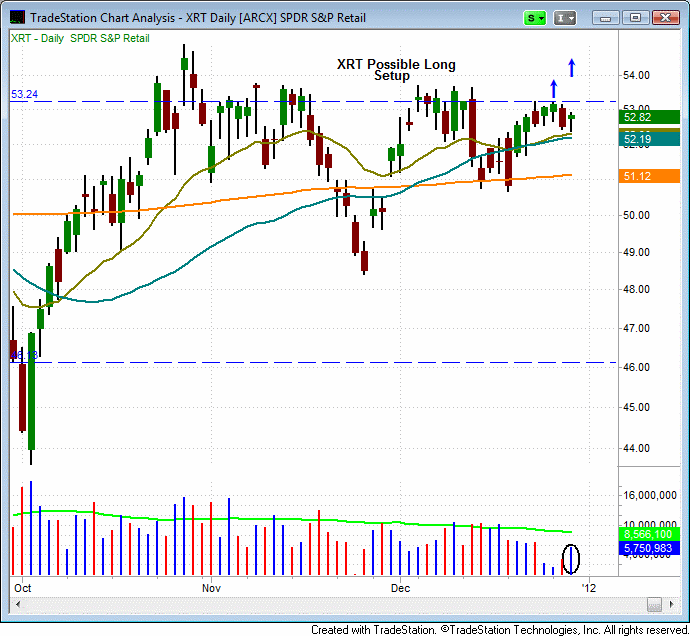
XRT
Long
Shares = 250
Trigger = 53.52
Stop = 52.20
Target = Retest of 52-week high
Dividend Date = n/a
Notes = see commentary from 12/30
Daily Performance Report:
Below is an overview of all open positions, as well as a performance report on all positions that were closed only since the previous day’s newsletter. Net P/L figures are based on the $50,000 Wagner Daily model account size. Changes to open positions since the previous report are listed in red text below. Please review the Wagner Daily Subscriber Guide for important, automatic rules on trigger and stop prices
- Per intraday alert, bought IYT above the 5-minute high. XRT did not trigger as it failed to move above the 5-minute high. Please note the new trigger, stop, and share size in today’s watchlist.
- Reminder to subscribers – Intraday Trade Alerts to your e-mail and/or mobile phone are normally only sent to indicate a CHANGE to the pre-market plan that is detailed in each morning’s Wagner Daily. We sometimes send a courtesy alert just to confirm action that was already detailed in the pre-market newsletter, but this is not always the case. If no alert is received to the contrary, one should always assume we’re honoring all stops and trigger prices listed in each morning’s Wagner Daily. But whenever CHANGES to the pre-market stops or trigger prices are necessary, alerts are sent on an AS-NEEDED basis. Just a reminder of the purpose of Intraday Trade Alerts.
- For those of you whose ISPs occasionally deliver your e-mail with a delay, make sure you’re signed up to receive our free text message alerts sent to your mobile phone. This provides a great way to have redundancy on all Intraday Trade Alerts. Send your request to [email protected] if not already set up for this value-added feature we provide to subscribers.

Having trouble seeing the position summary graphic above?
Click here to view it directly on your Internet browser instead.
Notes:
Edited by Deron Wagner,
MTG Founder and
Head Trader