market timing model:
Neutral – Signal generated on the close of December 13 (click here for more details)
today’s watchlist (potential trade entries):

Having trouble seeing the open positions graphic above? Click here to view it directly on your web browser instead.
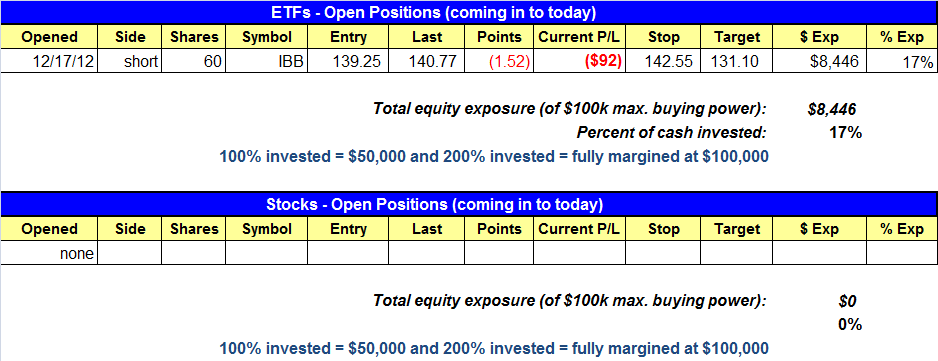
open positions:
Below is an overview of all open positions, as well as a report on all positions that were closed only since the previous day’s newsletter. Net P/L figures are based on two separate $50,000 model portfolios (one for ETFs and one for stocks). Changes to open positions since the previous report are listed in pink shaded cells below. Be sure to read the Wagner Daily subscriber guide for important, automatic rules on trade entries and exits.
Having trouble seeing the closed positions graphic above? Click here to view it directly on your web browser instead.
closed positions:

Having trouble seeing the open positions graphic above? Click here to view it directly on your web browser instead.
ETF position notes:
- $IBB and $QID setups triggered.
stock position notes:
- No trades were made.
ETF and broad market commentary:
After drifting sideways throughout the morning, the major indices caught a bid at mid-day, retraced the advance in the early afternoon, then rallied to close at their intraday highs and substantially higher. The Nasdaq Composite, which showed the most relative weakness last week, gained 1.3%. The S&P 500 trailed closely behind with a 1.2% advance, as the Dow Jones Industrial Average rose 0.8%. The small-cap Russell 2000 and S&P Midcap 400 indices climbed 1.4% and 1.0% respectively. Most notably, higher turnover accompanied yesterday’s rally. In both the NYSE and Nasdaq, total volume was about 7% higher than the previous day’s levels. As such, stocks scored a bullish “accumulation day” that was indicative of buying among banks, mutual funds, hedge funds, and other institutions.
After a week long shakeout below the prior swing low 10/31, iPath MSCI India Index ($INP) reversed sharply off the lows and back through the 50-day MA. We first mentioned $INP as a potential buy setup a few weeks ago after analyzing the weekly chart, which recently broke a two year downtrend line. After the initial thrust up, $INP has formed an 11-week base and is now back above the 50-day MA, attempting to put in a higher low. We are looking to build a position in $INP if it can hold support of the 20-day EMA and push higher. Trade details can be found in the today’s watchlist section above.

Per yesterday’s commentary, money continues to flow into international ETFs while domestic averages chop around. We managed to make a bit of money on recent swing trades in $FXI and $EPOL and are now waiting for low risk entry points to develop. Many of the international ETFs that have broken out have done so without presenting us with a low risk entry point. The iShares Thailand Index ($THD) is an example of this.

Note the downtrend line breakout followed by a strong thrust to new highs. There isn’t much of a pause on the move from 75.00 to 81.00. One could argue for an entry on the break of the downtrend line, but with no higher low (of significance) in place prior to the downtrend line break, such an entry was more of a gamble. We prefer to wait for higher lows to form which brings symmetry to the setup. For example, if a stock or ETF pulls back for 30 days and finally breaks above a short-term downtrend line, then the right side of the pattern should produce some sort of consolidation that is at least 10 to 15 days in length before breaking out. The left side of the pattern should not be 40 days in length while the right side is 10.
In yesterday’s commentary, we said the Nasdaq’s four-week bounce off its mid-November lows may be nearing an end. Although yesterday’s higher volume advance in the broad market was positive, nothing has changed on a technical level because the main stock market indexes still remain near the middle of their choppy, sideways ranges that have been in place for the past several weeks.
If anything, yesterday’s rally merely confirmed the current “neutral” mode of our market timing system, as this mode is most frequently used when stocks are exhibiting substantial day-to-day volatility, but without clear follow-through in either direction. Obviously, anything is possible in the stock market, so a sudden upside breakout above major resistance levels is certainly possible. But remember we are NOT in the business of predicting what the market will do. Rather, we merely observe what is happening at any given moment, and then objectively base our trading decisions on what we see, not what we think!
stock commentary:
Monday’s action produced strong breakouts in homebuilders, with $HOV, $MHO, $PHM, and $RYL up 6-10% on heavier than average volume. Can they hold on to these gains?
The lagging Nasdaq Composite put in a solid day of gains on higher volume and is now back above the 50 and 200-day MAs. Can it hold as well?
Yesterday’s advance produced about 155 stocks up 4% or more on higher volume, which is a decent number but we have yet to see a truly explosive day of buying, and that might be too much to ask in in the final two weeks of trading in December. For now we remain in cash; however, if recent breakouts hold and new patterns emerge, then we will be forced back in to the market with the timing model probably moving to a buy signal. If the market is headed much higher, then there will be plenty of setups along the way, so there is no need to rush into the market or feel like we are missing the move.
If you are a new subscriber, please e-mail [email protected] with any questions regarding our trading strategy, money management, or how to make the most out of this report.
relative strength combo watchlist:
Our Relative Strength Combo Watchlist makes it easy for subscribers to import data into their own scanning software, such as Tradestation, Interactive Brokers, and TC2000. This list is comprised of the strongest stocks (technically and fundamentally) in the market over the past six to 12 months. The scan is updated every Sunday, and this week’s RS Combo Watchlist can be downloaded by logging in to the Members Area of our web site.