market timing model:
Sell – Signal generated on the close of October 12 (click here for more details)
today’s watchlist (potential trade entries):

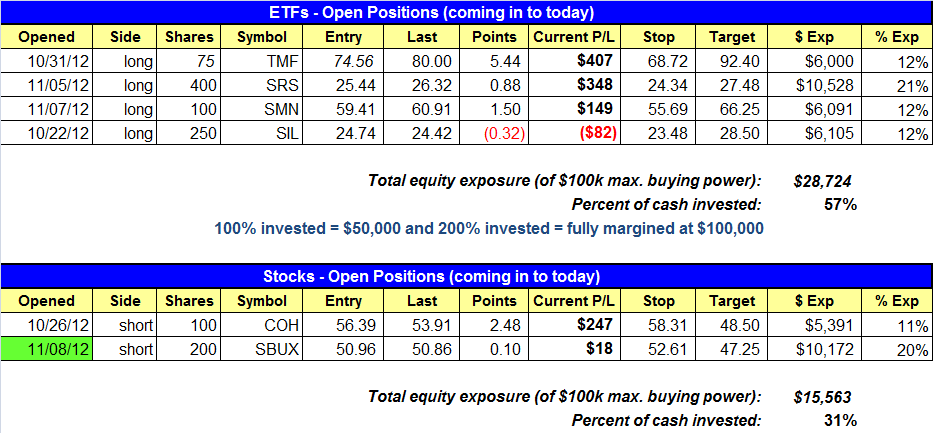
Having trouble seeing the open positions graphic above? Click here to view it directly on your web browser instead.
open positions:
Below is an overview of all open positions, as well as a report on all positions that were closed only since the previous day’s newsletter. Net P/L figures are based on two separate $50,000 model portfolios (one for ETFs and one for stocks). Changes to open positions since the previous report are listed in pink shaded cells below. Be sure to read the Wagner Daily subscriber guide for important, automatic rules on trade entries and exits.
Having trouble seeing the open positions graphic above? Click here to view it directly on your web browser instead.
closed positions:

Having trouble seeing the closed positions graphic above? Click here to view it directly on your web browser instead.
ETF position notes:
- No trades were made.
stock position notes:
- SBUX short setup triggered.
ETF and broad market commentary:
Building on the previous day’s weakness, stocks opened flat, then settled into a persistent intraday downtrend all the way to the closing bell. The Dow Jones Industrial Average ($DJIA) shed 0.9%, the S&P 500 Index ($SPX) 1.2%, and the Nasdaq Composite ($COMPX) 1.4%. Both the small-cap Russell 2000 Index ($RUT) and S&P Midcap 400 Index ($MID) fell 1.3%. All the main stock market indexes closed at their dead lows of the day.
Total volume in the NYSE was 13% lighter than the previous day’s level, while volume in the Nasdaq receded 9%. Like the previous day, declining volume firmly outnumbered advancing volume, indicating the weakness was broad-based among various industry sectors. As we’ve mentioned before, downtrending markets can easily fall on lighter volume due simply to a lack of demand to absorb supply, even if the actual selling pressure is not that substantial.
Thanks to our market timing system remaining in “sell” mode (since October 12), we continue to be positioned primarily on the short side of the market (including being long “short ETFs”). Over the past two days, those bearish positions have started working out nicely. We bought ProShares UltraShort Basic Materials ETF ($SMN) on Nov. 7 and ProShares UltraShort Real Estate ETF ($SRS) on Nov. 5, two inversely correlated ETFs that move in the opposite direction of their underlying indexes, as bullish trend reversalplays. Yesterday, SMN gained 2.8% and SRS rallied 1.9%, as both ETFs broke out above key horizontal price resistance levels. This is annotated on the daily charts of both ETFs below:


In addition to SMN and SRS, our position in Direxion 20-Year Treasury Bull 3x ($TMF) also had a great day. Government treasury bonds rallied sharply, enabling TMF to rocket 4.5% higher yesterday. Although it is not a short position or inverse ETF, our ETF trading strategy enabled us to recently buy TMF because it is a fixed-income ETF that is not necessarily correlated to the direction of the stock market. The same is generally true of currency and commodity ETFs, both of which enable investors and traders to have a low correlation to the direction of the stock market, without the need to sell short or buy a “short ETF.” As you can see on the chart below, TMF has now confirmed its intermediate-term trend reversal, and has convincingly broken out above horizontal price resistance as well:

Going into today, we are targeting two more ETFs for potential swing trade entry. The first is ProShares UltraShort Financials ($SKF), which is another trend reversal play of a “short ETF.” After forming a month long base near its multi-year lows, the ETF recently formed a “higher low,” then broke out above intermediate-term resistance of its 50-day moving average on higher than average volume. As you may recall from yesterday’s newsletter, in which we pointed out the breakdown in Select Sector Financial SPDR ($XLF), bearish momentum has started picking up in the financial sector. As such, we are looking to take advantage of this newfound weakness through buying SKF. However, because the ETF has rallied so much over the past two days, we are only interested in buying SKF if it pulls back slightly from its current level (buy limit order). Otherwise, our reward to risk ratio on the trade would be lower than we prefer. The trade setup and potential entry point is shown on the chart below (note our exact entry, stop, and target prices on the ETF Watchlist section of today’s newsletter):

The second ETF on our watchlist for potential buy entry today is US Natural Gas Fund ETF ($UNG), a commodity ETF that tracks the price of the natural gas futures contracts. Although we were recently exited this ETF as a losing trade on November 2, it is now setting up for an ideal re-entry point that is lower risk than our initial buy entry because the ETF has now come into intermediate-term support of its 50-day moving average. In addition to trading in a tight, sideways range for the past four days, UNG also formed abullish engulfing candlestick pattern yesterday, which enables us to have a clearly defined stop price just below yesterday’s low. This combination of technical factors indicates selling pressure has subsided, and the ETF is now positioned to resume its uptrend from the April 2012 lows. The setup for this ETF pullback trade is shown below:

When will the near and intermediate-term selling pressure in the broad market finally subside? We have no idea, nor does anybody else. But the beauty of following a rule-based trading system is that it really doesn’t matter because we can profit from trends in either direction. Moreover, remember that we are NOT in the business of predicting what the market will do next. Rather, our strategy is simply designed to dynamically react to whatever type of price action the broad market is exhibiting. Developing a mindset to not care about market direction or duration of trends is not easy at first, but once you learn to be indifferent about the market’s direction, or how long a trend will persist, it will definitely ease any level of mental stress or anxiety, which in turn will enable you to think clearly and maximize your short-term trading profits.
stock commentary:
We finally got the follow through we were looking for in $COH yesterday, as it broke down below all major averages and closed at the lows of the day, down more than 5%. Although we have a target in place, exactly where we cover will depend on how the stock sells off and how the market reacts the next few days. $SBUX triggered and closed at the lows of the day. Let’s see if it can follow through to the downside.
Since shifting the timing model to neutral on October 8, we have completely avoided the long side with regard to equities, and in doing so probably saved ourselves a ton of frustration (and money). We continue to see many traders on social media sites talk about buying $AAPL off the lows intraday, and day after day $AAPL continues to sink. Many of these same traders have absolutely no idea that they should not be buying stocks at all when the market is in distribution mode. They simply see bullish patterns and assume it is a great buy. Bullish patterns work in a bull market. You take away the bull market and bullish patterns such as flags, cup and handles, flat bases, and pennants do not work / have no edge. While others continue to bang heads against the wall buying the right patterns at the wrong time, new traders can shorten their learning curve dramatically by following and learning a systematic approach and sticking with that approach in good times and in bad.
If you are a new subscriber, please e-mail [email protected] with any questions regarding our trading strategy, money management, or how to make the most out of this report.
relative strength combo watchlist:
Our Relative Strength Combo Watchlist makes it easy for subscribers to import data into their own scanning software, such as Tradestation, Interactive Brokers, and TC2000. This list is comprised of the strongest stocks (technically and fundamentally) in the market over the past six to 12 months. The scan is updated every Sunday, and this week’s RS Combo Watchlist can be downloaded by logging in to the Members Area of our web site.