market timing model:
Neutral – Signal generated on the close of October 5 (click here for more details)
today’s watchlist (potential trade entries):
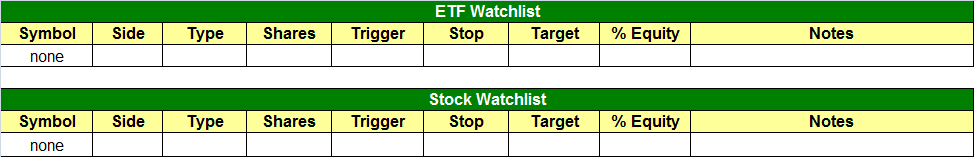
Having trouble seeing the open positions graphic above? Click here to view it directly on your web browser instead.
open positions:
Below is an overview of all open positions, as well as a report on all positions that were closed only since the previous day’s newsletter. Net P/L figures are based on two separate $50,000 model portfolios (one for ETFs and one for stocks). Changes to open positions since the previous report are listed in pink shaded cells below. Be sure to read the Wagner Daily subscriber guide for important, automatic rules on trade entries and exits.
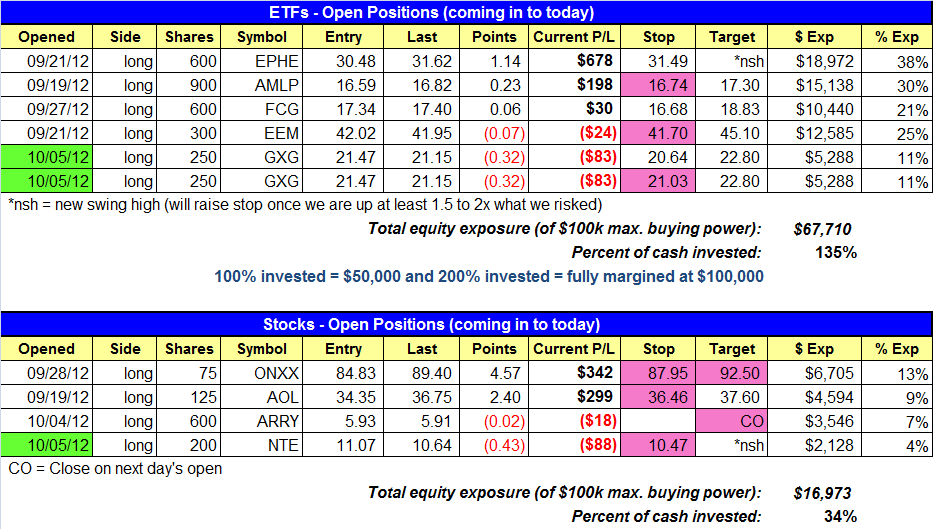
Having trouble seeing the open positions graphic above? Click here to view it directly on your web browser instead.
closed positions:
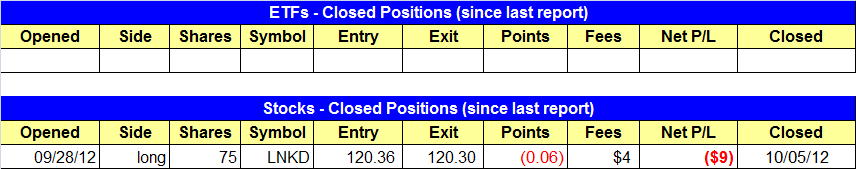
Having trouble seeing the closed positions graphic above? Click here to view it directly on your web browser instead.
ETF position notes:
- GXG is listed twice due to the split stops.
stock position notes:
- We are selling ARRY on the open.
- LNKD hit its breakeven stop and we are out w/ a small scratch loss.
ETF and broad market commentary:
After creeping higher for four consecutive days, the major indices gapped to a higher opening last Friday morning, but this time the sellers took control ahead of the weekend. Reversing lower after the first hour of trading, stocks subsequently settled into a steady intraday downtrend that persisted into the close. Surrendering a morning gain of 0.7%, the Nasdaq Composite ($COMPX) closed 0.4% lower. Both S&P 500 Index ($SPX) and S&P Midcap 400 Index ($MID) drifted lower intraday before finishing at the flat line. The small-cap Russell 2000 Index ($RUT) dipped 0.2%. Edging 0.3% higher, only the blue-chip Dow Jones Industrial Average ($DJIA) eked out a closing gain. All the main stock market indexes settled near the bottom of their intraday trading ranges.
Total volume in the NYSE receded 12%, but turnover in the Nasdaq ticked 3% higher than the previous day’s level. The higher volume decline in the Nasdaq caused the index to register another bearish “distribution day,” indicative of selling amongst banks, mutual funds, hedge funds, and other institutions. This means the Nasdaq has now suffered four “distribution days” in recent weeks. As we mentioned last week, the presence of four or more days of higher volume selling (“distribution days”) in an index is frequently an early warning signal, a leading indicator, that the near to intermediate-term uptrend in a market is in danger of ending. Furthermore, it’s concerning that the broad market’s recovery off the September 26 “swing lows” has generally lacked increasing volume on the way up. Given recent volume patterns, there are now much greater odds of at leastsubstantial price correction in the broad market on the horizon, particularly in the Nasdaq.
Going into this week, there are 5 objective, technical reasons why we feel the stock market may be poised for a significant pullback:
- Four “distribution days” on the Nasdaq
- Lack of increasing volume as the market has been rising
- Key short-term resistance levels being tested on the S&P and Dow ($SPY and $DIA)
- Head and Shoulders pattern on the Nasdaq 100 ($QQQ)
- Relative weakness in the small and mid-cap indexes ($IWM and $MDY)
The first of the five reasons above are already discussed in the second paragraph of today’s commentary. Following, we will look at charts of the major indices that illustrate the remaining three reasons why the stock market may be poised for a significant pullback. In today’s ETF trading commentary, we will briefly analyze chart patterns of the following ETFs that are popular ETF proxies for their respective underlying indexes: S&P 500 Index ($SPY), Dow Jones Industrial Average ($DIA), Nasdaq 100 Index ($QQQ), small-cap Russell 2000 Index ($IWM), and S&P Midcap 400 Index ($MDY).
Because it is a narrow index comprised of only 30 stocks, the direction of the Dow Jones Industrial Average is not really a good indicator of overall stock market health. Nevertheless, because the popular financial news media outlets always seem to focus on how many points the Dow is up or down each day, the technical importance of the index becomes self-fulfilling, due primarily to retail investors basing their market decisions largely on the performance of the Dow. That being said, let’s look at the daily chart of $DIA, the most well-known ETF that tracks the index:

The benchmark, broad-based S&P 500 Index has a similar chart pattern to the Dow, in that it is also testing resistance of its prior “swing highs,” although it has been showing slightly less relative strength during the most recent climb off the September lows. Below is the daily chart of the S&P 500 SPDR ($SPY), the main ETF proxy for the performance of the S&P 500 Index:

Although both DIA and SPY are testing resistance of their prior “swing highs” from September, such action alone would not be concerning because the indexes could simply form a multi-week base of consolidation near current price levels, then eventually continue to new highs again. However, of legitimate concern is the relative weakness in QQQ, IWM, and MDY. For example, QQQ is presently forming the right shoulder of a bearish head and shoulders pattern, which is most easily annotated with an intraday chart interval of 120 minutes (each bar is two hours of price action):

A head and shoulders pattern that forms after an extended rally follows through to the downside a relatively high percentage of the time. However, with this pattern, we typically would not initiate a short position or use it exclusively as a signal to exit a position until it follows through to break the neckline after forming the right shoulder. This is because failed head and shoulders that rally above the “head” after forming the “right shoulder” often lead to explosive upside moves. Therefore, although QQQ is looking pretty bad in the near-term, due to the formation of the right shoulder, we would need to see a breakdown below the “neckline” before selling short QQQ or buying the corresponding inversely correlated ETFs ($PSQ or $QID).
Although our system for trading ETFs affords more flexibility than our stock trading strategy in flat to downtrending markets (with typically lower gains as well), our strategy for swing trading individual stocks is focused primarily on profiting from momentum in leading small and mid-cap stocks. As such, what may be even more concerning than the head and shoulders pattern on QQQ is the relative weakness both the small and mid-cap indexes have been exhibiting since rallying off their late September lows. Using theFibonacci indicator on the daily chart patterns, notice that both IWM and MDY have only recovered about 50% of their respective declines from the mid-September highs to late September lows:


Unlike DIA and SPY, both of which have already rallied back to test resistance of their mid-September highs, notice that IWM and MDY have only managed to recover about 50% of their respective price retracements off their prior highs. This tells us that institutions have not been avoiding rotation into more volatile and aggressive small and mid-cap stocks in recent weeks, thereby pointing to a decreased appetite for risk. This recent decline of bullish momentum in small and mid-cap stocks is why we said in our October 3 newsletter were shifting to a more proactive stance with regard to tight stops on existing stock positions, as well as reducing share size on new trade entries.
The increasing occurrence of “distribution days” on the Nasdaq, the lack of increasing volume on the way up (“accumulation days”), resistance in the S&P and Dow, the head and shoulders pattern on QQQ, and relative weakness in small and mid-caps are 5 good reasons why the overall stock market may soon be setting up for a substantial downward price correction. Nevertheless, long-time subscribers of The Wagner Daily know we are not in the business of predicting what the market will do; rather, we continually remain prepared for the most likely scenarios to occur, and then make the necessary reactions to what the market gives us. Put quite simply, it’s imperative to remember that our successful trading system relies on trading what we see, NOT what we think. We already have tightened our protective stops in the event of an anticipated correction, and are even prepared with a possible short position (or inverse ETF position) in QQQ should it break down below support of its neckline on the chart above.
stock commentary:
The lack of relative strength in small and midcap stocks the past few weeks has been disappointing and especially so for the small cap Russell 2000 Index, which was coming back to life late in the summer. We prefer to operate with the lesser known names because they have explosive potential and give us the ability to lock in 10-20% moves in two weeks or less. The charts below show the recent relative weakness in both the S&P 400 and Russell 2000:


ARRY has failed to hold above 6.00 once again, so we are selling our position on Monday’s open, which should be near break-even.

We are running pretty tight stops on existing positions due to all the warning sings the past few weeks (listed above). For now, we feel it is best to play it safe and wait for conditions to improve.
If you are a new subscriber, please e-mail [email protected] with any questions regarding our trading strategy, money management, or how to make the most out of this report.
relative strength combo watchlist:
Our Relative Strength Combo Watchlist makes it easy for subscribers to import data into their own scanning software, such as Tradestation, Interactive Brokers, and TC2000. This list is comprised of the strongest stocks (technically and fundamentally) in the market over the past six to 12 months. The scan is updated every Sunday, and this week’s RS Combo Watchlist can be downloaded by logging in to the Members Area of our web site.