Buy Mode
– Timing model generated buy signal on close of March 5 (click here for more details)
today’s watchlist (potential trade entries):

Having trouble seeing the open positions graphic above? Click here to view it directly on your web browser instead.
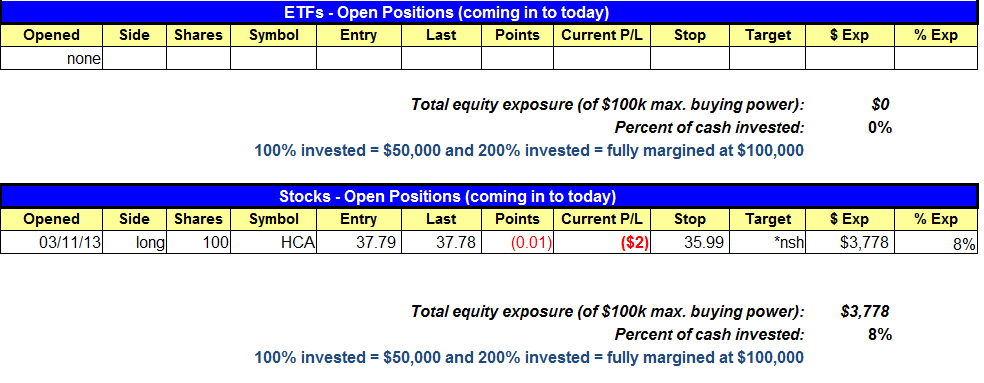
open positions:
Below is an overview of all open positions, as well as a report on all positions that were closed only since the previous day’s newsletter. Net P/L figures are based on two separate $50,000 model portfolios (one for ETFs and one for stocks). Changes to open positions since the previous report are listed in pink shaded cells below. Be sure to read the Wagner Daily subscriber guide for important, automatic rules on trade entries and exits.

Having trouble seeing the open positions graphic above? Click here to view it directly on your web browser instead.
closed positions:

Having trouble seeing the closed positions graphic above? Click here to view it directly on your web browser instead.
ETF position notes:
- Canceled $TBT buy setup.
stock position notes:
- $HCA buy setup triggered. Canceled $NTE and $BC buy setups.
ETF, stock, and broad market commentary:
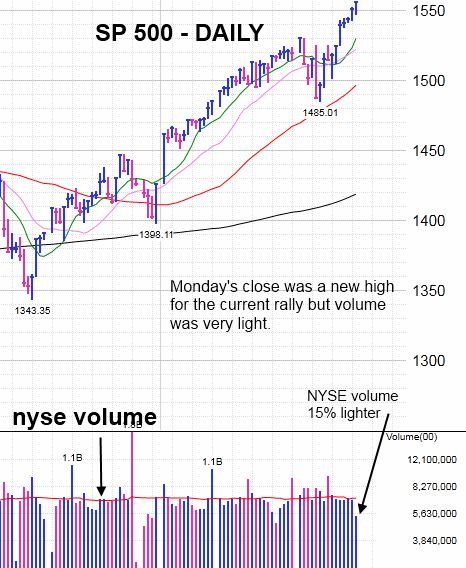
The S&P 500, Nasdaq Composite, S&P Midcap 400, and Dow Jones Industrials ended the session at a new closing high for the current rally on Monday. While the market pushes higher, we continue to see problems under the hood. Volume was heavier on the Nasaq, but 15% lighter on the NYSE. The light volume move to new swing highs on the S&P 500 is not a good sign for the bulls. Aside from the heavy volume gap up to new swing highs on March 5, NYSE volume has been disappointing during the the current bounce off the swing low. While price action is always king, the light volume does not sit well with us.

$TAN closed below the 50-day MA yesterday, but the buy setup is still in play. If $TAN is unable to recapture the 50-day MA within a few days, then it may have to sell off to the 200-day MA and build a full basing pattern, which is at least 7 weeks in length (from the high of Feb. 20).
We canceled the $TBT buy setup and are now waiting for a weekly close above 69.64 as the buy signal. If we decide to short $TLT, we may replace the leveraged ETF $TBT with the non-leveraged ProShares Short 20+ Year Treasury ($TBF). Although we feel that $TBT is a decent vehicle for swing trading quick moves of one to four weeks, non-leveraged products tend to outperform during longer holding periods.
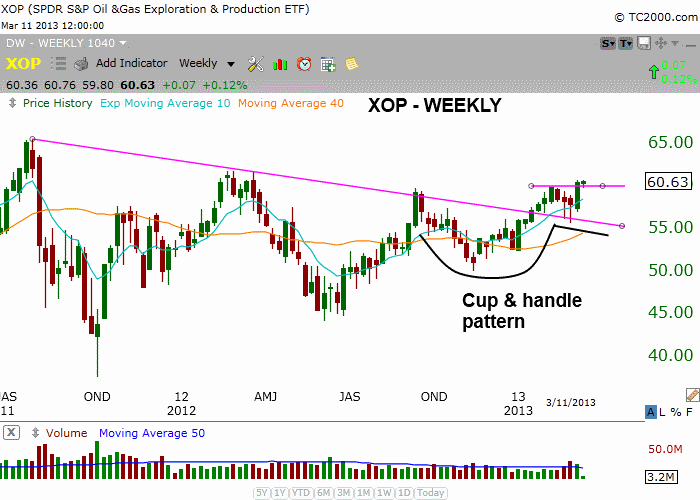
Along with financials, energy stocks have led the S&P 500 higher the past several weeks. The weekly chart below of the SPDR S&P Oil & Gas Exploration & Production ($XOP) shows a bullish cup and handle pattern that is nearly complete. A close above the high of last week’s candle in the next few weeks will produce a buy signal.

The price action has tightened up nicely since last September. We also like the bullish crossover in the moving averages, with the 10-week MA now clearly above 40-week MA and both averages are trending higher.
On the stock side, $HCA triggered our buy stop and we are now long. The price action sold off late in the afternoon, but still managed to close above the highs of the 7-day range.
Due to the light volume move to new swing highs in the S&P 500, we mading a judgment call to cancel the remaining buy setups in $NTE and $BC. Both setups remain valid and can be traded unofficially with the trade details posted in Monday’s report. However, for the moment, we feel it is best to hold off on initiating new positions, especially when these new positions are not A rated setups (think along the lines of $LNKD for A-Rated).
relative strength combo watchlist:
Our Relative Strength Combo Watchlist makes it easy for subscribers to import data into their own scanning software, such as Tradestation, Interactive Brokers, and TC2000. This list is comprised of the strongest stocks (technically and fundamentally) in the market over the past six to 12 months. The scan is updated every Sunday, and this week’s RS Combo Watchlist can be downloaded by logging in to the Members Area of our web site.