Current signal generated on close of September 9.
Portfolio long exposure can be anywhere from 50% to 100% or more if you have positions that help up while the market sold off.
Past signals:
- Neutral signal generated on close of August 15
- Buy signal generated on close of July 11
- Neutral signal generated on close of July 5
- Sell signal generated on close of June 24
today’s watchlist (potential trade entries):

Having trouble seeing the open positions graphic above? Click here to view it directly on your web browser instead.
open positions:
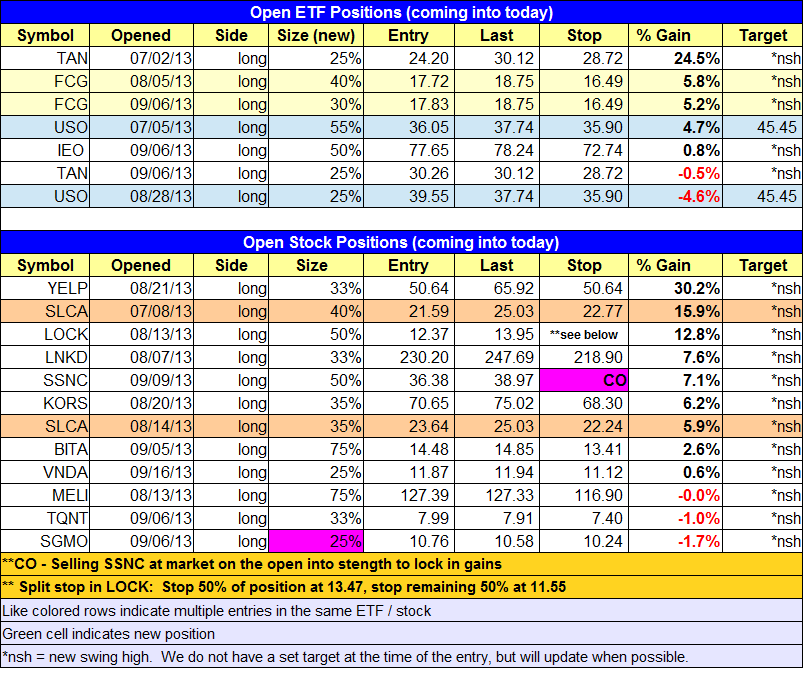
Below is an overview of all open positions, as well as a report on all positions that were closed only since the previous day’s newsletter. Changes to open positions since the previous report are listed in pink shaded cells below. Be sure to read the Wagner Daily subscriber guide for important, automatic rules on trade entries and exits. Click here to learn the best way to calculate your share size.
Having trouble seeing the open positions graphic above? Click here to view it directly on your web browser instead.
closed positions:

Having trouble seeing the closed positions graphic above? Click here to view it directly on your web browser instead.
ETF position notes:
- Cancelled $EGPT setup in favor of $XBI (more relative strength).
stock position notes:
- Note the changes in $SCTY. $BERY sell stops triggered and we are out with a small loss. We plan to sell $SSNC at market on the open. Stopped out of half our $SGMO position.
ETF, stock, and broad market commentary:
Stocks rallied across the board on lighter volume on Tuesday, led by a a 1.0% gain in the small cap Russell 2000, which joined the NASDAQ Composite in setting a new 52-week high.
The Fed will release its decision on rates tomorrow afternoon (2:15), so we can expect some afternoon volatility. Over the years, we have noticed that many traders will not take a position in a stock ahead of the Fed or even move to a 100% cash position before the report. The way we deal with the Fed is the way we deal with all news, we simplify everything down to price and volume action. Our goal is to concentrate on the price and volume action of each stock, as that will tell us when to buy, sell, or hold. It’s not the news that matters to us, so much as how our stocks/ETFs respond to the news.
SPDR S&P Biotech ($XBI) has broken out to new highs for the year well ahead of the S&P 500, which is detailed on the chart below:
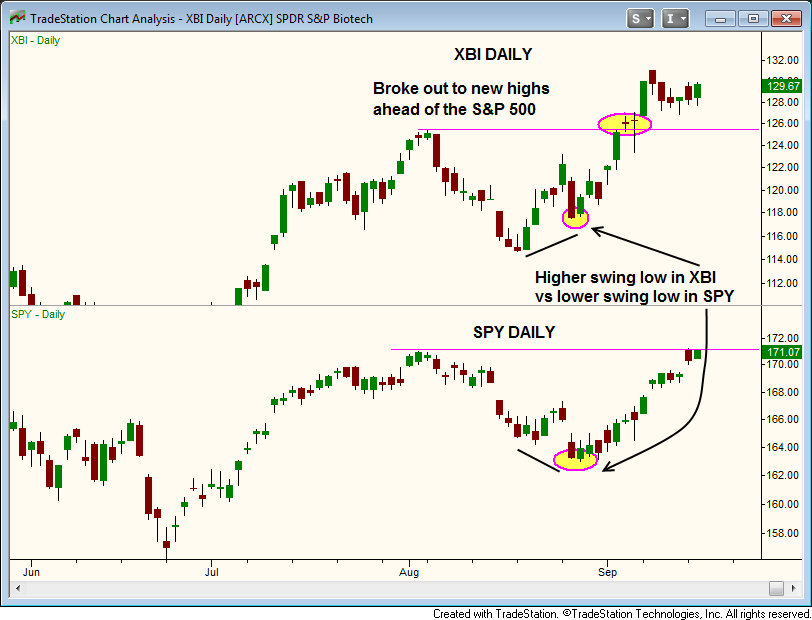
Along with the move to new highs ahead of the broad based averages, $XBI also set a higher low vs the S&P 500 while the market was in pullback mode.
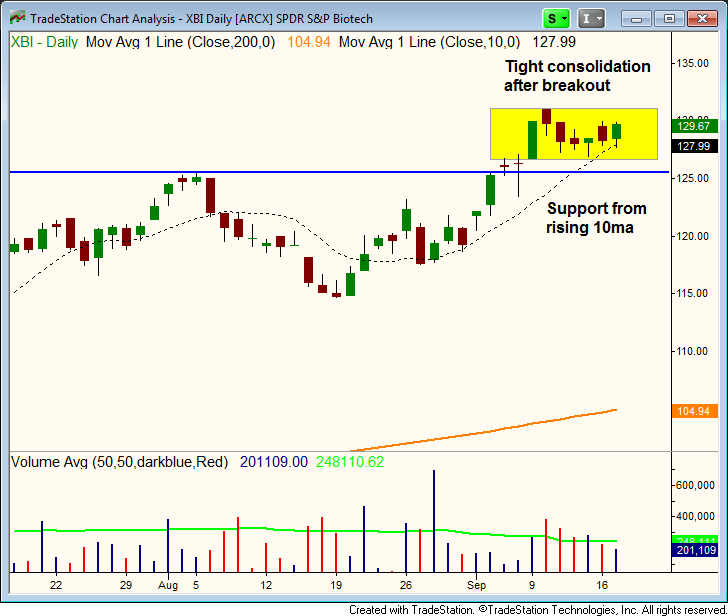
$XBI is currently consolidating in a tight range, just above the rising 10-day MA. Note the declining volume during the consolidation the past few days, which is a bullish sign. We are stalking $XBI for a breakout entry which should lead to new highs over the next few weeks. Trade details can be found in the watchlist section above.
We stopped out of $BERY yesterday, after a nasty intraday selloff, that saw the price action rollover to the 200-day MA. The end result should be a very small loss, as our first stop triggered for a 6.9% gain, while the second stop triggered for a 7.0% loss.
We are selling $SSNC at market into strength on the open, to lock in a gain. $SGMO hit our tight stop yesterday, but we remain long with half size.
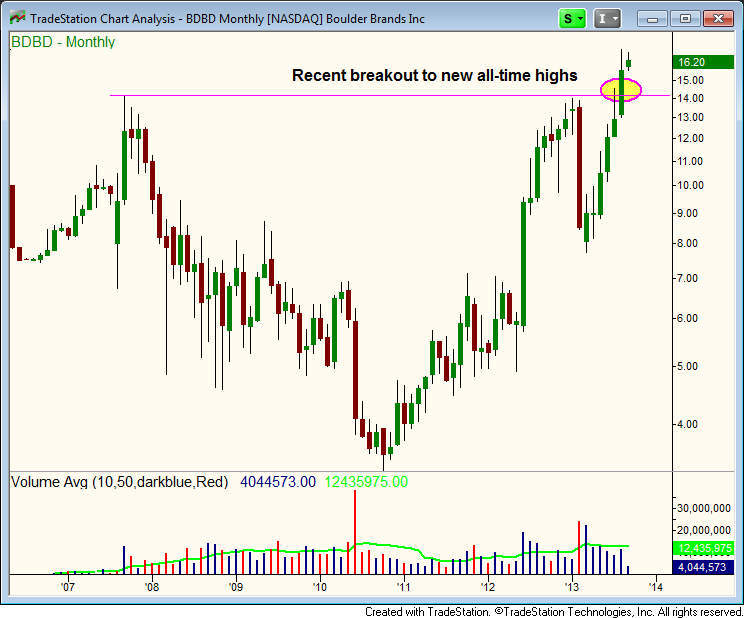
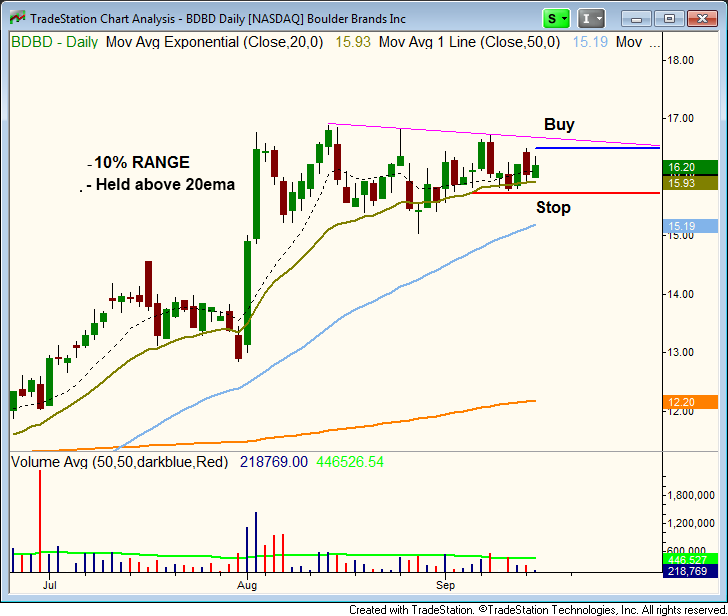
We have one new buy setup for today in $BDBD. Note the tight price action on the daily chart, as the correction is only 10% off the swing highs at the lows of the range, which has held above the 20-day EMA. Our buy entry is over the two-day high, which should lead to a downtrend line breakout and a move to new highs within a few days. The stop is below the swing low. This is not a stock we are looking to hold for more then 1-2 weeks, unless the price and volume action just explodes higher.
On the monthly chart below, we see that $BDBD has just broken out to new all-time highs. This types of breakouts can lead to explosive price action.
