Commentary:
For the fourth consecutive day stocks closed lower. But for a late session rally, all of the major indices would have closed near the session lows. The burst of buying brought the Nasdaq, S&P 500 and the DJIA off the bottom, but the mid and small cap indices did not participate in the late surge. For a third consecutive day the small-cap Russell 2000 and the S&P MidCap 400 led the decline. They finished lower by 1.5% and 1.0% respectively. The Nasdaq and the Dow Jones Industrial Average both plunged 1.0% while the S&P 500 shed 0.8% for the session.
Market internals ended the session mixed. Volume was up on the NYSE by 16.7%, but down on the Nasdaq by 8.2%. Declining volume outpaced advancing volume on both indices. The declining volume to advancing volume ratio ended the day at 2.1 to 1 on the NYSE and 4.1 to 1 on the Nasdaq. The increase in volume and significant price decline would suggest institutional selling on the NYSE. Light trade on the Nasdaq suggests there was no institutional involvement in yesterday’s selloff of this index.
Yesterday we exited part of our position in SSG as it was approaching resistance. Given the recent lack of follow through in the market, we felt that it was prudent to take some of our gains off the table. Further, it is always good to sell into strength because the trade is generally filled at a better price. We also raised the stop on the remaining portion of the trade. Trade details are available to our members in the open positions section of the newsletter.
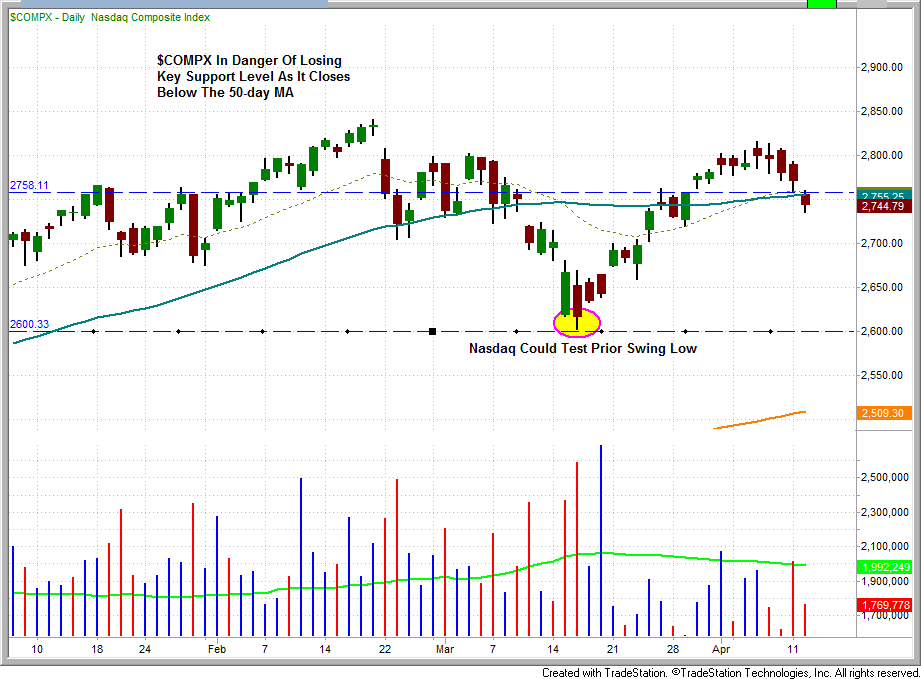
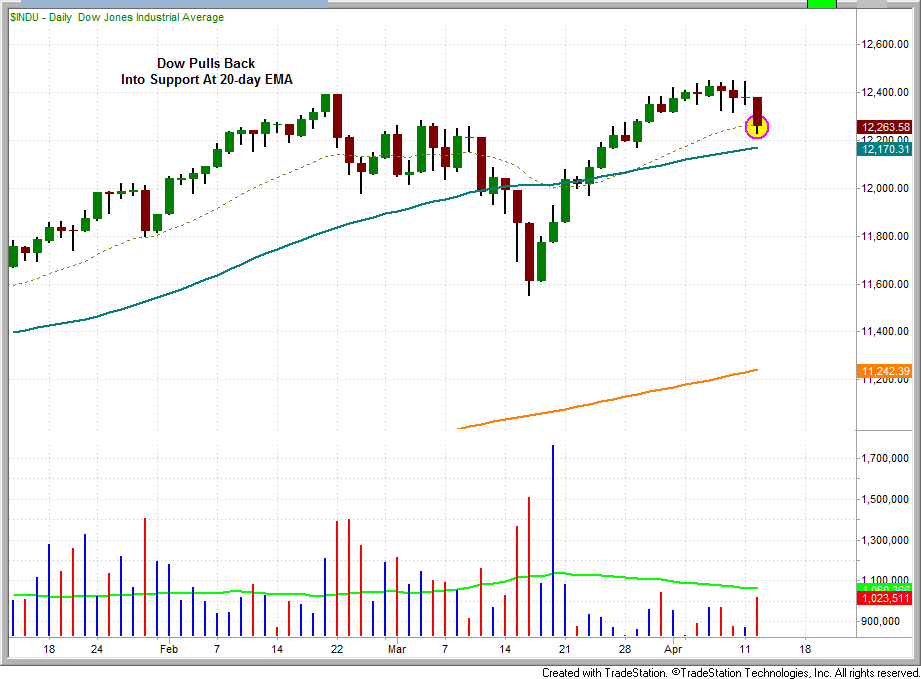
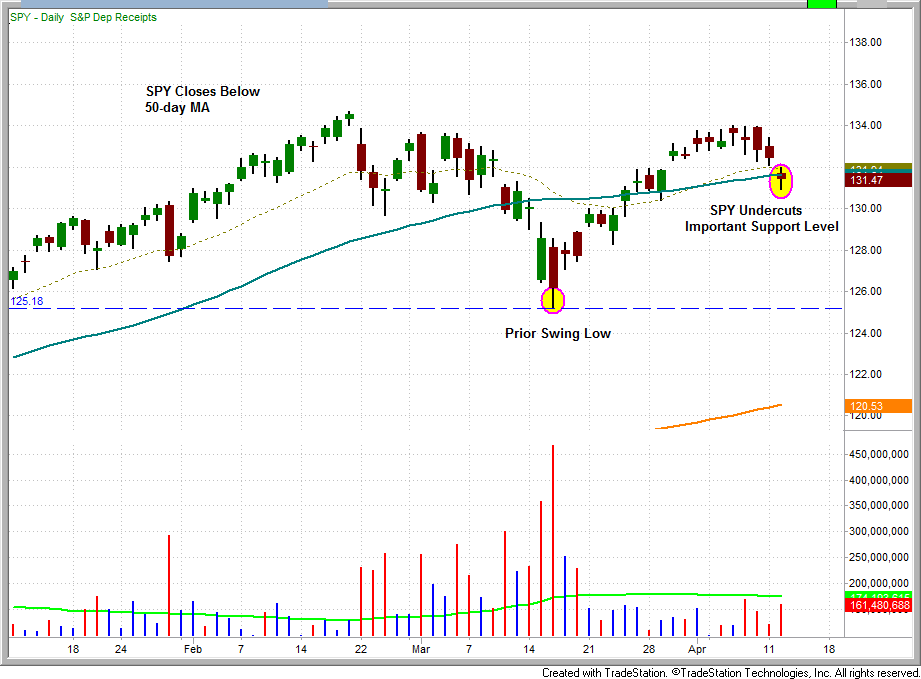
Because all of the major indices have pulled back into major support levels, we anticipate either consolidation or a possible bounce in the market today. If the market loses support at the current levels, then we could potentially see a retest of the prior swing lows. A quick look at the $COMPX, $INDU, and SPY provides a clear picture of the importance of the support levels we are testing.


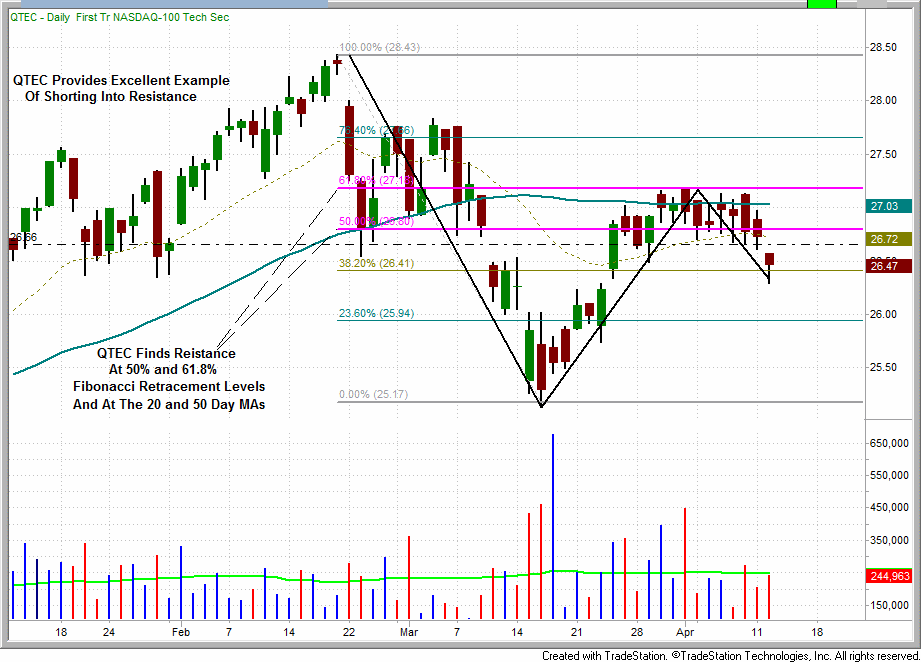
The First Trust NASDAQ-100 Tech Sector Index ETF (QTEC) provides an excellent example of shorting into resistance. After selling off for nearly a month, on March 16th QTEC found support and subsequently rallied back into its 20-day EMA and 50-day MA. These moving averages also correspond with the 50% and 61.8% Fibonacci Retracements. For the past two weeks QTEC consolidated between the moving averages but was unable to move above its 50-day MA when the broad market moved higher. QTEC’s relative weakness provided evidence that it could be a potential short candidate during a market correction. Yesterday QTEC lost support of the three day low ($26.60) and could easily see more downside.

Sector rotation continues to dominate the market landscape. For the past several days Semiconductors, Technology, Oil, Energy, Transportation and Emerging Market ETFs have taken the brunt of the selling, while Biotech’s, Pharmaceuticals, Retail and Healthcare ETFs have fared well. When large scale sector rotation enters the market it can be difficult for significant market moves to take hold. There is a lack of broad market participation during rallies and pullbacks. By definition, the strong and weak sectors counterbalance one another and hinder day over day follow through in the market. Consequently, losses must be cut quickly and profits must be banked quickly. What we have been witnessing over the past several days is selling in sectors that have gone straight up and buying in sectors that have been laggards during this bull market. This type of price action often appears when markets have reached an extreme. We are not calling a market top since the current price action could also be interpreted as consolidation. Further, the major indices continue to hold support. Still, it is concerning that the Nasdaq closed below the 50-day MA yesterday. In our opinion the market is at an important crossroad. We would not be surprised if a final surge of buying entered the market before the next significant reversal. If this potential surge lacked broad based participation (and volume) then this would provide another sign that the bull market was weakening and a significant pullback may be at hand.
Today’s Watchlist:
There are no official setups this morning. As always, we will send an Intraday Alert if any new trades are made.
Daily Performance Report:
Below is an overview of all open positions, as well as a performance report on all positions that were closed only since the previous day’s newsletter. Net P/L figures are based on the $50,000 Wagner Daily model account size. Changes to open positions since the previous report are listed in red text below. Please review the Wagner Daily Subscriber Guide for important, automatic rules on trigger and stop prices

Having trouble seeing the position summary graphic above? Click here to view it directly on your Internet browser instead.
Notes:
-
Per intraday alert, sold 40% of SSG to lock in gains and raised the stop on the remaining shares.
-
Reminder to subscribers – Intraday Trade Alerts to your e-mail and/or mobile phone are normally only sent to indicate a CHANGE to the pre-market plan that is detailed in each morning’s Wagner Daily. We sometimes send a courtesy alert just to confirm action that was already detailed in the pre-market newsletter, but this is not always the case. If no alert is received to the contrary, one should always assume we’re honoring all stops and trigger prices listed in each morning’s Wagner Daily. But whenever CHANGES to the pre-market stops or trigger prices are necessary, alerts are sent on an AS-NEEDED basis. Just a reminder of the purpose of Intraday Trade Alerts.
-
For those of you whose ISPs occasionally deliver your e-mail with a delay, make sure you’re signed up to receive our free text message alerts sent to your mobile phone. This provides a great way to have redundancy on all Intraday Trade Alerts. Send your request to [email protected] if not already set up for this value-added feature we provide to subscribers.
Edited by Deron Wagner,
MTG Founder and Head Trader