sell
today’s watchlist (potential trade entries):

open positions:
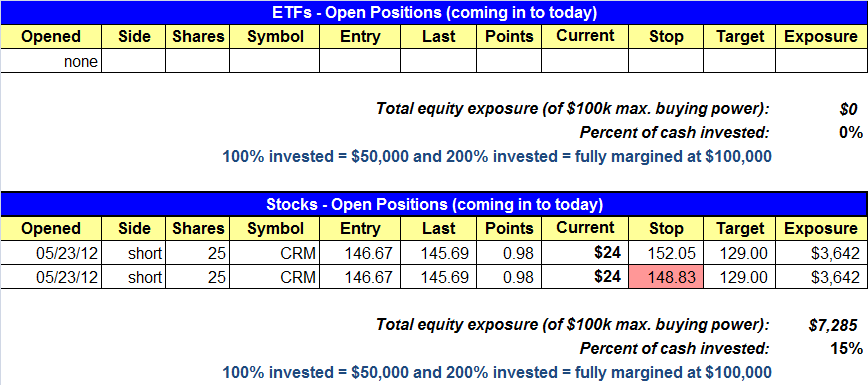
Below is an overview of all open positions, as well as a report on all positions that were closed only since the previous day’s newsletter. Net P/L figures are based on two separate $50,000 model portfolios (one for ETFs and one for stocks). Changes to open positions since the previous report are listed in red shaded cells below. Be sure to read the Wagner Daily subscriber guide for important, automatic rules on trade entries and exits.

Having trouble seeing the open positions graphic above? Click here to view it directly on your web browser instead.
closed positions:

Having trouble seeing the closed positions graphic above? Click here to view it directly on your web browser instead.
ETF position notes:
- Cancelled IYT setup.
stock position notes:
- No trades were made.
ETF and broad market commentary:
Stocks moved higher yesterday as trade accelerated. All five major indices added 1% or more. The small-cap Russell 2000 and the S&P MidCap 400 led the advance by posting 1.4% and 1.3% gains respectively. The Nasdaq tacked on 1.2%. The S&P 500 followed closely with a 1.1% advance while the Dow Jones Industrial Average managed a 1.0% improvement.
Market internals were bullish yesterday. Volume spiked on the Nasdaq by 28.1% and on the NYSE by 19.7%. Advancing volume topped declining volume on the NYSE by an impressive 7.6 to1 and on the Nasdaq by 2.7 to 1. Yesterday’s strong market internals suggest institutional accumulation across the board.
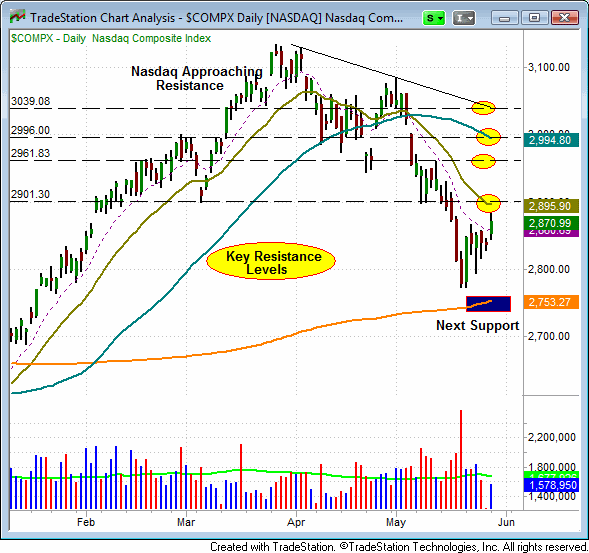
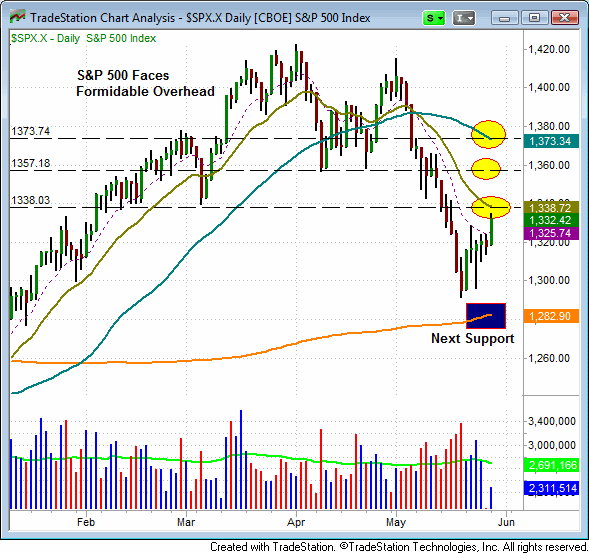
Over the past five sessions, the market has begun to show signs of a potential reversal. However, there is still a lot of overhead to get through and we are inclined to be cautious about changing our bearish sentiment of the market. A quick review of the Nasdaq and the S&P 500 should help to clarify why we are not overly anxious to go long the market without further confirmation.
Notice that the Nasdaq is approaching resistance at its 20-day MA (2,900 area). If it is able to reclaim this key mark, there is still an ample supply of sellers at 2960, 3000 and 3040. Further, it is unusual for an index to lose support of its 20-day and 50-day MAs and come in striking distance of its 200-day MA without testing/undercutting the 200-day moving average.

The S&P 500 also faces formidable resistance. The S&P is now within six points of its 20-day EMA (1340 area). If it can reclaim support of its 20-day EMA, the S&P still must work its way through key overhead near 1360 and 1375. As with the Nasdaq, the S&P 500 has support at its 200-day. Again, it is unusual for an index to come within striking distance of the 200-day MA without testing this key mark.

Yesterday’s performance was impressive as it resulted in an accumulation day on both the NYSE and the Nasdaq. However, price action was just a bit weaker than we like to see to declare a buy signal for the broad market. Nonetheless, today’s accumulation day comes on the heels of last Wednesday’s reversal day and we have to be respectful that the market could put in a buy signal quickly.
stock commentary:
CRM is listed twice in the open positions section due to the split stop. We lowered the stop on half the position to just above the 20-period EMA on the hourly chart.
The market timing model remains on a sell signal. Despite yesterday’s strong accumulation day there simply isn’t enough evidence to support going long right now….especially with the major averages below the 50-day MA. Patience is key right now as we wait for low risk short setups to develop by the end of the week.
If you are a new subscriber, please e-mail [email protected] with any questions regarding our trading strategy, money management, or how to make the most out of this report.
relative strength watchlist:
Our Relative Strength (or RS) Watchlist makes it easy for subscribers to import data into their own scanning software, such as Tradestation, Interactive Brokers, and TC2000. This list is comprised of the strongest 100 (or so) stocks in the market over the past six to 12 months. The scan is updated every Sunday, and this week’s RS Watchlist can be downloaded by logging in to the Members Area of our web site.