market timing model:
BUY (click here for more details)
today’s watchlist (potential trade entries):

open positions:
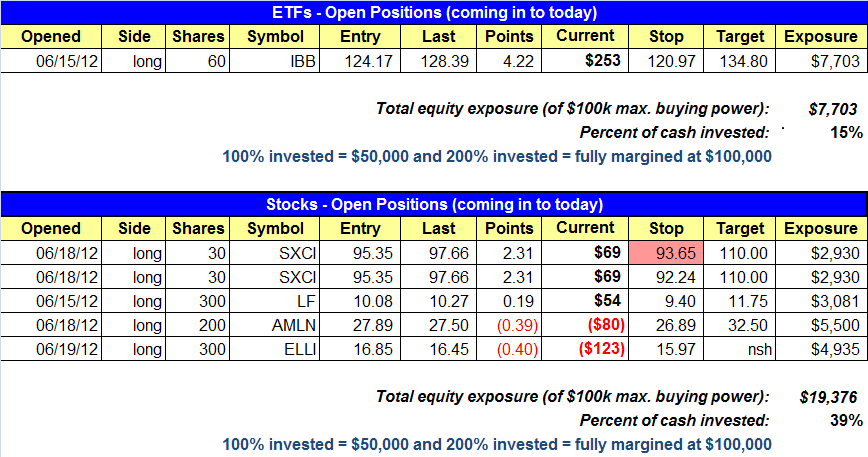
Below is an overview of all open positions, as well as a report on all positions that were closed only since the previous day’s newsletter. Net P/L figures are based on two separate $50,000 model portfolios (one for ETFs and one for stocks). Changes to open positions since the previous report are listed in red shaded cells below. Be sure to read the Wagner Daily subscriber guide for important, automatic rules on trade entries and exits.

Having trouble seeing the open positions graphic above? Click here to view it directly on your web browser instead.
closed positions:

Having trouble seeing the closed positions graphic above? Click here to view it directly on your web browser instead.
ETF position notes:
- Note the heavy position size in UUP is due to the small ATR that it trades with. We are only risking about $300 on the trade, which is $200-$300 below our max average loss.
stock position notes:
- We raised the stop on half the position in SXCI.
ETF and broad market commentary:
Stock closed mixed on Wednesday, on mixed trade. Despite finishing mostly lower yesterday, all of the major indices closed near session highs. The Nasdaq showed relative strength yesterday, as it was the only index to close up on the day. The tech-rich index closed fractionally higher. The Dow Jones Industrial Average slid 0.1%, while both the S&P MidCap 400 and the S&P 500 slid 0.2%. The small-cap Russell 2000 dropped 0.3%.
Wednesday’s action brought mixed internals. Volume fell on the Nasdaq by 14.3% but closed modestly higher on the NYSE. On the NYSE declining volume narrowly topped advancing volume by a factor of 1.1 to 1. However, the Nasdaq saw advancing volume hold the upper hand by a factor of 1.3 to 1. Yesterday’s internals were neutral, as they provided no indication of institutional accumulation or distribution.
Over the past three weeks, the PowerShares DB US Dollar Bull ETF (UUP) has sold off and pulled back into support of its 50-day MA. Over the past two sessions, UUP has tested support at this key moving average. UUP offers a potential long opportunity above the two day high of $22.53. We are placing UUP on the watchlist. Trade details are available to our subscribers in the watchlist segment of the newsletter.

Our long position in IBB continues to act well. IBB showed bullish price action, as it tested Tuesday’s low but recovered to close near the two day high. Although there was some selling pressure yesterday, for the most part, stocks closed near session highs. We consider yesterday’s price action ideal, following four consecutive days of buying. Other than the S&P MidCap 400, all of the major indices tested and held support of their 50-day moving averages. The mid-cap index is the only one of the five that has yet to reclaim its 50-day moving average. We anticipate that the market may consolidate for a few more days before it takes another potential move higher.
stock commentary:
There are no new official plays for today. Our scans have turned up a few decent buy setups each day this week, but we want to keep our long exposure below 50% of equity until we see follow through in our open positions.
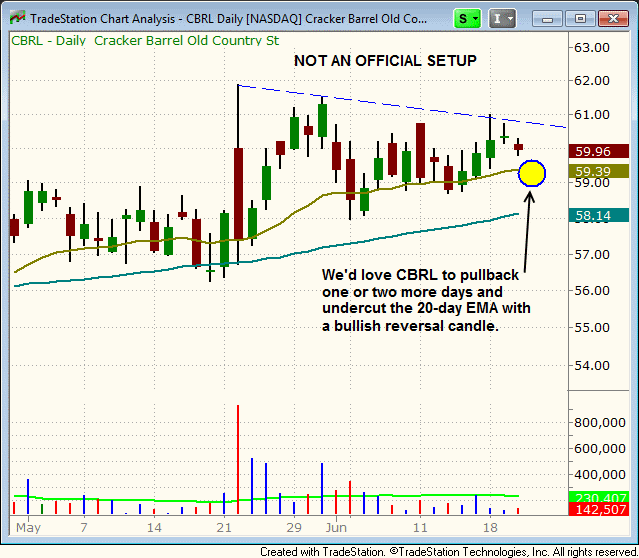
CBRL is another chart we are monitoring for an entry point. Although we’d like CBRL to pullback one or two more days to form a lower risk entry point, it could simply breakout above the three-day high and run to new highs very quickly. The chart below details the setup. This is not an official trade.

Note: The setups below are for aggressive traders who feel comfortable taking positions that we are not officially in. These setups are meant as swing trades with a 1 to 4 week holding period. For a simple target measure the distance from the entry to the stop price and multiply by 2. Add this number to your entry and you have a basic 2 to 1 target.
- CBRL – buy 61.10, stop 58.60
- AVD – buy 26.73, stop 25.26
- TXRH – buy 18.28, stop 17.52
- TUDO – buy 37.76, stop 35.77
If you are a new subscriber, please e-mail [email protected] with any questions regarding our trading strategy, money management, or how to make the most out of this report.
relative strength watchlist:
Our Relative Strength (or RS) Watchlist makes it easy for subscribers to import data into their own scanning software, such as Tradestation, Interactive Brokers, and TC2000. This list is comprised of the strongest 100 (or so) stocks in the market over the past six to 12 months. The scan is updated every Sunday, and this week’s RS Watchlist can be downloaded by logging in to the Members Area of our web site.