market timing model:
Neutral – Signal generated on the close of August 2 (click here for more details)
today’s watchlist (potential trade entries):

open positions:
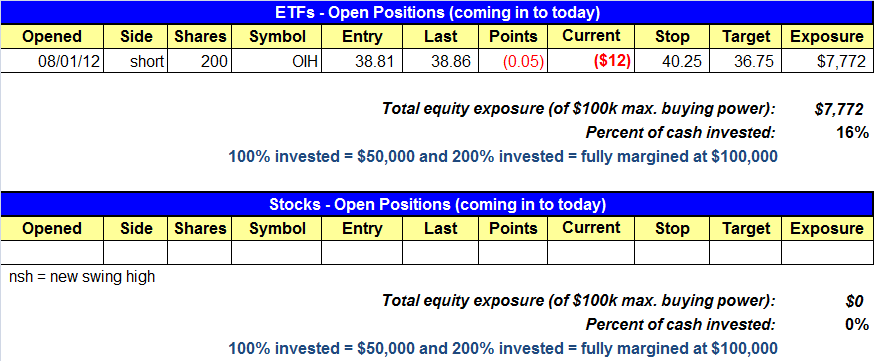
Below is an overview of all open positions, as well as a report on all positions that were closed only since the previous day’s newsletter. Net P/L figures are based on two separate $50,000 model portfolios (one for ETFs and one for stocks). Changes to open positions since the previous report are listed in red shaded cells below. Be sure to read the Wagner Daily subscriber guide for important, automatic rules on trade entries and exits.

Having trouble seeing the open positions graphic above? Click here to view it directly on your web browser instead.
closed positions:

Having trouble seeing the closed positions graphic above? Click here to view it directly on your web browser instead.
ETF position notes:
- No trades were made.
stock position notes:
- Closed AOS long position.
ETF and broad market commentary:
Stocks continued their recent losing streak, as they posted their fourth consecutive losing session yesterday. Trade was mixed. Despite another weak day on Wall Street, the major indices managed to close off session lows. The Dow Jones Industrial Average and the S&P 500 dropped 0.7% and 0.8% respectively. S&P MidCap 400 continues to show relative weakness, as it fell 0.6% and closed below its 200-day MA for the first time in since July 25th. The the tech-heavy Nasdaq slid 0.4% on higher trade. Although the small-cap Russell 2000 fell the least on Thursday, it has demonstrated the most relative weakness over the past several weeks. The Russell is the only index within mere points of breaking below its July 24th swing low.
Yesterday was the Nasdaq’s turn to post a distribution day. Volume increased by 6.2% on the Nasdaq, while declining volume topped advancing volume by 2.0 to 1 on this index. Turnover on the NYSE fell by 5.2%, but the lighter volume was not surprising, given Wednesday’s high volume due to the Knight Capital Debacle. Declining volume topped advancing volume on the Big Board by 3.7 to 1.
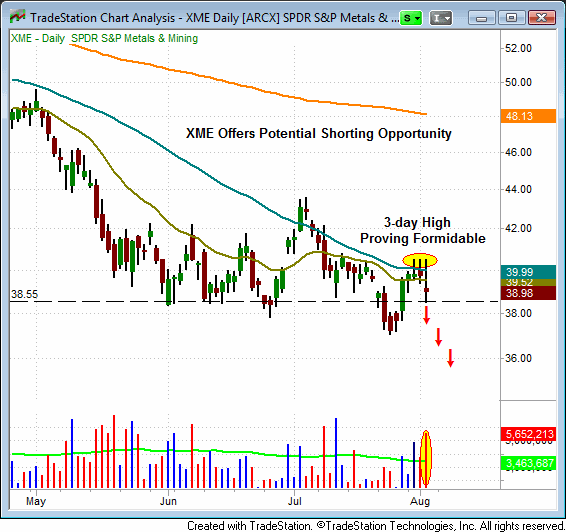
On a pop in volume, the SPDR S&P Metals and Mining ETF (XME) formed a bearish reversal candle as it tested its two day high, but weakened dramatically to close near session lows. A drop below yesterday’s low of $38.55 could provide a short entry trigger for this ETF. We are placing XME on the watchlist. Trade details are available to our clients in the watchlist section of the Newsletter. For those of you trading qualified accounts, the Direxion Daily Gold Miners 3x Bear ETF (DUST) would serve as a reasonable, although not precise, proxy to XME. DUST is not an official trade.

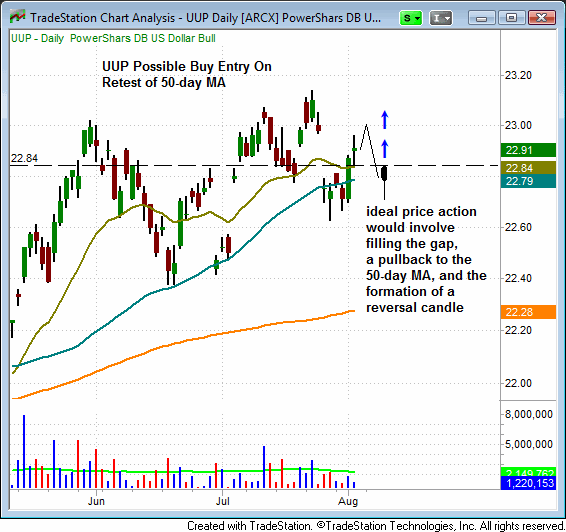
The Powershares DB US Dollar Bull ETF (UUP) has been in an uptrend for several months and is now consolidating near its 20-day and 50-day moving averages. This ETF could provide a buying opportunity on a pullback and undercut of its 50-day MA. The chart below provides the ideal price action that we would like to see in order to enter UUP on the long side. We will continue to monitor this ETF for a potential long entry.

Our open short position (OIH) dropped 2.7% yesterday, but recovered to close well off session lows. Turnover was heavy in OIH. We would have preferred to see weaker price action into the close, but if the market remains weak, OIH should continue to push lower. Yesterday brought more distribution to the market. Further, leadership stocks continue to fragment. Yesterday’s casualties included LF, ZUMZ and HTWR. Evidence is mounting that the market may soon make a more substantial move lower. Still, given the recent “chopfest” in the market, we wouldn’t be shocked if it remained range bound until the fall. At a minimum, there is considerable repair that must occur prior to any moves higher.
stock commentary:
With Wednesday’s distribution the model shifts back into neutral mode. Why? Whenever we have two distribution days within a few days of a buy signal that is usually not a good sign for the bulls.
Traders who have been disciplined enough to follow our system the past few months should be in good shape mentally, which along with capital preservation is a main concern when trading in a tough market. Many traders may have overtraded like crazy the past few months and are now in a big hole, while we simply followed our market timing model and made 1% last month. Although some traders take positions for the rush and have a hard time sitting in cash or trading with reduced share size, we know from experience that knowing when not to trade may be the hardest skill of all to learn (and carry out) in the market.
There are no new setups for today. Our plan is to lay low on Friday and see what the scans look like over the weekend.
Note: We have replaced the Relative Strength watchlist with the Relative Strength Combo watchlist. This new list combines strong price action with top fundamentals to produce ideal candidates on the long side. Stocks that make this are NOT an automatic buy. Each pattern must be examined for a low risk entry point before any action is taken. The number of stocks on this watchlist will vary depending on market conditions. This list is not a recommendation to buy.
If you are a new subscriber, please e-mail [email protected] with any questions regarding our trading strategy, money management, or how to make the most out of this report.
relative strength combo watchlist:
Our Relative Strength Combo Watchlist makes it easy for subscribers to import data into their own scanning software, such as Tradestation, Interactive Brokers, and TC2000. This list is comprised of the strongest stocks (technically and fundamentally) in the market over the past six to 12 months. The scan is updated every Sunday, and this week’s RS Combo Watchlist can be downloaded by logging in to the Members Area of our web site.