market timing model:
BUY (click here for more details)
today’s watchlist (potential trade entries):

open positions:
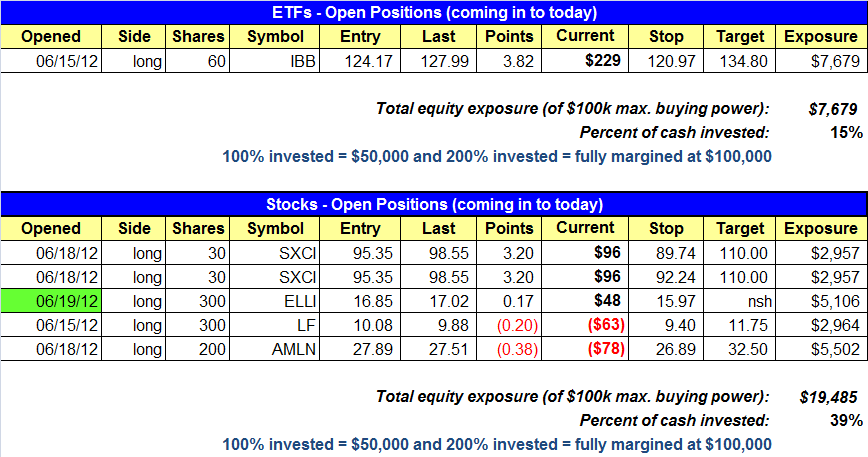
Below is an overview of all open positions, as well as a report on all positions that were closed only since the previous day’s newsletter. Net P/L figures are based on two separate $50,000 model portfolios (one for ETFs and one for stocks). Changes to open positions since the previous report are listed in red shaded cells below. Be sure to read the Wagner Daily subscriber guide for important, automatic rules on trade entries and exits.

Having trouble seeing the open positions graphic above? Click here to view it directly on your web browser instead.
closed positions:

Having trouble seeing the closed positions graphic above? Click here to view it directly on your web browser instead.
ETF position notes:
- No trades were made.
stock position notes:
- Long ELLI triggered.
ETF and broad market commentary:
Stocks closed higher on Tuesday as trade improved. All five major indices closed well in positive territory. The small-cap Russell 2000 put in the most impressive showing, as it tacked on 1.8%. The Nasdaq added 1.2%, while the S&P MidCap 400, S&P 500 and Dow Jones Industrial Average advanced 1.1%, 1.0% and 0.7% respectively.
Market internals finished bullish on Tuesday. Volume ended higher by 15.0% on the Nasdaq and 11.0% on the NYSE. Advancing volume easily topped decl ining volume by a ratio of 5.3 to 1 on the NYSE and 5.0 to 1 on the Nasdaq. Yesterday’s bullish accumulation day lends more confirmation to last Friday’s follow through day, which put our market timing model on a buy signal.
Although we have a buy signal in place, we are now at resistance of the 50-day MA on all of the major indices. This would suggest that we may see either a pullback from or consolidation at the current levels over the next several sessions. Now that we are at a key resistance level in the broad market, a brief review of the Nasdaq and the S&P 500 are in order
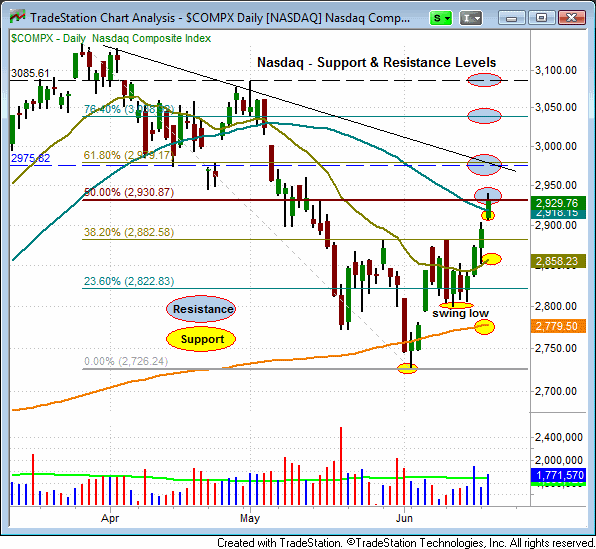
Nasdaq Composite: Key Support & Resistance Levels
On a burst of volume, the Nasdaq closed above its 50-day MA yesterday and this level should now offer some support. However, it is not unusual for a stock, index or ETF to pull back from its first attempt to crack through a major moving average, following a significant move lower. If the Nasdaq should hold the 50-day MA, its next significant resistance level is near 2980. If $COMPX eventually pulls back from its current level, it will probably retest and find resistance at yesterday’s high before moving lower. Above this mark, $COMPX has significant overhead near 2980 and 3085. Yesterday’s low, the 20-day EMA and the 200-day MA should act as important support levels for the Nasdaq.

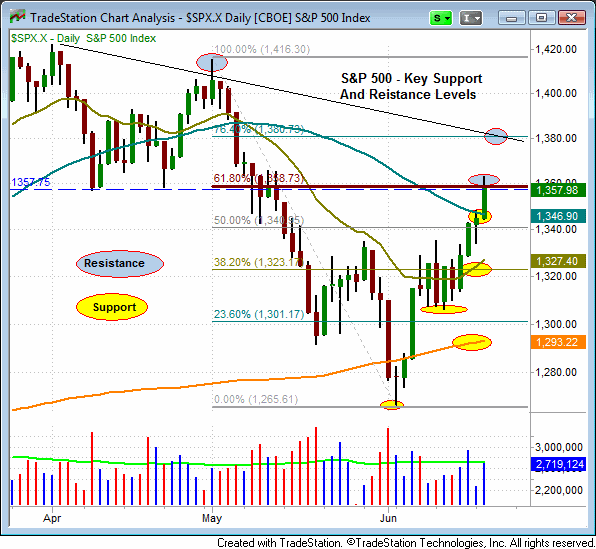
S&P 500: Important Support & Resistance Levels
The S&P 500 also surged above its 50-day MA yesterday on higher volume. Yesterday’s high (1363), 1380 and 1420 should all present resistance for the S&P. As with the Nasdaq, the 50-day, 20-day and 200-day moving averages are significant support levels on the $SPX.X.

With the market in buy mode we will focus most of our attention on identifying long setups during market pull backs. It would take several significant distribution days to nullify the recent price action on the long side of the market. Keep in mind that the first move higher following a market correction does not generally yield stellar results. The important thing is that we continue to see institutional accumulation during pullbacks and as the market works its way higher.
stock commentary:
There are no new official setups for today. We do have a few unofficial setups below for aggressive traders. These trades are not official and their results will not be tracked.
- AVD – buy 26.73, stop 25.26
- TXRH – buy 18.28, stop 17.52
- TUDO – buy 37.76, stop 35.77
Note: The setups above are for aggressive traders who feel comfortable taking positions that we are not officially in. These setups are meant as swing trades with a 1 to 4 week holding period. For a simple target measure the distance from the entry to the stop price and and multiply by 2. Add this number to your entry and you have a basic 2 to 1 target.
If you are a new subscriber, please e-mail [email protected] with any questions regarding our trading strategy, money management, or how to make the most out of this report.
relative strength watchlist:
Our Relative Strength (or RS) Watchlist makes it easy for subscribers to import data into their own scanning software, such as Tradestation, Interactive Brokers, and TC2000. This list is comprised of the strongest 100 (or so) stocks in the market over the past six to 12 months. The scan is updated every Sunday, and this week’s RS Watchlist can be downloaded by logging in to the Members Area of our web site.