market timing model:
Sell – Signal generated on the close of October 12 (click here for more details)
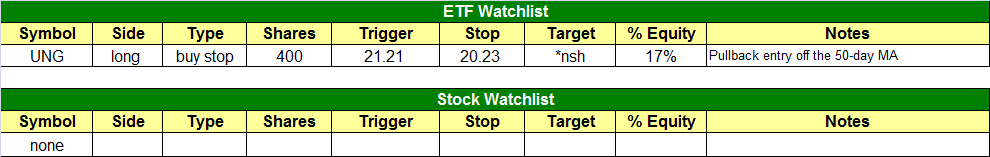
today’s watchlist (potential trade entries):
Having trouble seeing the open positions graphic above? Click here to view it directly on your web browser instead.
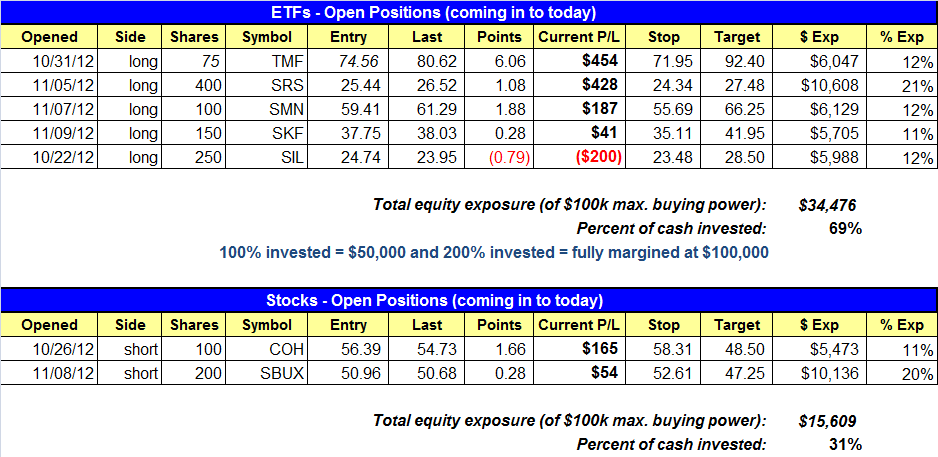
open positions:
Below is an overview of all open positions, as well as a report on all positions that were closed only since the previous day’s newsletter. Net P/L figures are based on two separate $50,000 model portfolios (one for ETFs and one for stocks). Changes to open positions since the previous report are listed in pink shaded cells below. Be sure to read the Wagner Daily subscriber guide for important, automatic rules on trade entries and exits.
Having trouble seeing the open positions graphic above? Click here to view it directly on your web browser instead.
closed positions:

Having trouble seeing the closed positions graphic above? Click here to view it directly on your web browser instead.
ETF position notes:
- No trades were made.
stock position notes:
- No trades were made.
ETF and broad market commentary:
After bobbing and weaving in a tight, sideways range throughout the entire day, all the main stock market indexes finished within 0.1% of unchanged levels. Overall, it was a great big day of “blah” in which the bulls and bears were on parity, but neither party had much to prove. Dramatically reduced turnover across the board confirmed the apathy in yesterday session. Total volume in the NYSE swooned 63%, while volume in the Nasdaq receded 23% below the previous day’s level. It was the third straight day of lighter volume in both the NYSE and Nasdaq.
On a technical level, yesterday’s price action was indicative of essentially nothing but a lack of commitment, and can be clearly seen on the daily chart patterns. Each of the major indices formed an inside day, which occurs when the intraday trading range is completely contained within the previous day’s trading range. Furthermore, most of the main stock market indexes formed a doji star candlestick pattern. This forms when when the open and close for the day are the same, or nearly the same, and the intraday trading range on both sides of the open/close is narrow and roughly equal. Both the inside day and doji star patterns are shown below on the daily chart of the S&P 500 SPDR ($SPY), a popular ETF proxy for the benchmark S&P 500 Index ($SPX):

Since it was such an uneventful day, we’ll keep today’s ETF and broad market commentary concise. Not surprisingly, no new valid ETF trade setups were created, and our general near-term trading plan remains the same as was explained in detail in yesterday’s analysis of PowerShares QQQ Trust ($QQQ). To recap, we continue building an internal watchlist of weak ETFs to sell short when they eventually bounce into formidable price resistance levels, then provide us with a trigger point for entry by forming a bearish reversal candle. So far, both $QQQ and $IBB are on that list, the latter of which we will discuss and analyze in tomorrow’s newsletter.
For now, we remain well-positioned with five different open ETF positions in our model trading portfolio, and four of those five positions continue to show unrealized gains. Note that US Natural Gas Fund ($UNG) is back on our “official” watchlist for potential buy entry today (see our exact trigger, stop, and target prices above).
In case you missed the live event, be sure to log in to the Members Area of our website and download (or stream) the recording of yesterday’s live webinar. In the first half of the webinar, we recap our open positions and look at a few other stocks, but the second half of the webinar provide you with a basic primer on our short selling strategy for stocks and ETFs. If you are new to swing trading or short selling, viewing the latter half of the video is highly recommended, especially considering that the broad market remains in a convincing short to intermediate-term downtrend and our market timing model remains in “sell” mode.
stock commentary:
An ugly market eventually takes down all stock no matter how strong. Yesterday, it was the homebuilder’s turn to take one on the chin with $HOV, $MHO, $KBH, $LEN, and $MDC all closing at least 4% lower. Another relative strength stock $DDD, was also hit hard selling off 8% on heavy volume. The price action in $DDD is becoming a bit volatile and may need several weeks to settle down and set up properly. Remember that volatility is the enemy of swing trading, as it becomes very difficult to locate low risk entry points with wide candles/bars all over the place.

With the market averages failing to bounce much over the past few days, there hasn’t been much to talk about on short side in terms of new setups. We already have two quality short positions in former leadership stocks $COH and $SBUX and would not minding adding more exposure. However, we never chase price action. We must be patient and wait for our pitch.
If you are a new subscriber, please e-mail [email protected] with any questions regarding our trading strategy, money management, or how to make the most out of this report.
relative strength combo watchlist:
Our Relative Strength Combo Watchlist makes it easy for subscribers to import data into their own scanning software, such as Tradestation, Interactive Brokers, and TC2000. This list is comprised of the strongest stocks (technically and fundamentally) in the market over the past six to 12 months. The scan is updated every Sunday, and this week’s RS Combo Watchlist can be downloaded by logging in to the Members Area of our web site.