today’s watchlist (potential trade entries):

open positions:
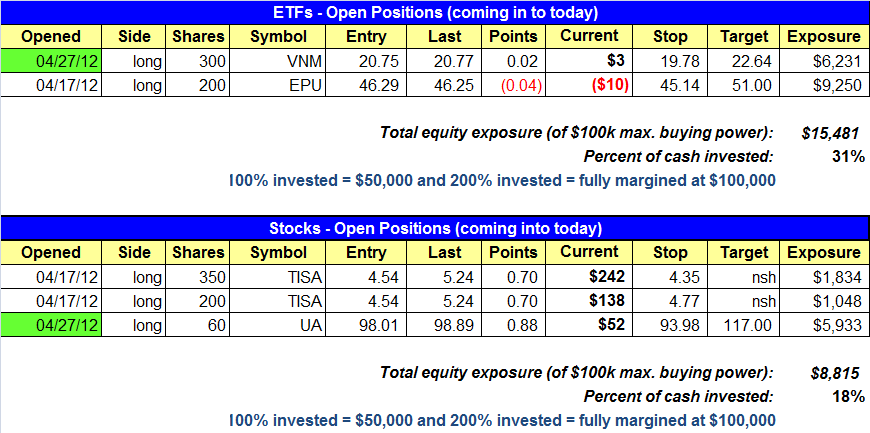
Below is an overview of all open positions, as well as a report on all positions that were closed only since the previous day’s newsletter. Net P/L figures are based on two separate $50,000 model portfolios (one for ETFs and one for stocks). Changes to open positions since the previous report are listed in a pink shaded cell below. New entries are shaded in green cells. Be sure to read the Wagner Daily subscriber guide for important, automatic rules on trade entries and exits.

Having trouble seeing the open positions graphic above? Click here to view it directly on your web browser instead.
closed positions:

Having trouble seeing the closed positions graphic above? Click here to view it directly on your web browser instead.
ETF position notes:
- VNM long triggered.
stock position notes:
- UA long triggered.
SPECIAL NOTE: The only gap rule we are now using applies strictly to entries, where a setup is automatically cancelled if it opens more than 1.3% above or below the trigger price. For example: If the trigger on a buy setup is $20.00 and the price opens higher than 20.26 (20.00 x 1.013%), then the trade is automatically cancelled. As a reminder, when a stock gaps below the listed stop price we automatically sell the stock “at the market” on the open.
ETF and broad market commentary:
Equities posted modest gains on Friday on mixed trade. The small-cap Russell 2000 showed the most relative strength on the day, as it posted a 0.9% gain. The Nasdaq added 0.6%, while the S&P MIdCap 400 rose 0.4%. Both the S&P 500 and the Dow Jones Industrial Average added 0.2%.
For a second consecutive day, internals were mixed. Volume increased 0.6% on the Nasdaq but fell 3.2% on the NYSE. Advancing volume was higher across the board, as the spread ratio ended at a plus 1.4 to 1 on the NYSE and a plus 1.2 to 1 on the Nasdaq. Albeit modest, the Nasdaq posted a second consecutive accumulation day on Friday.
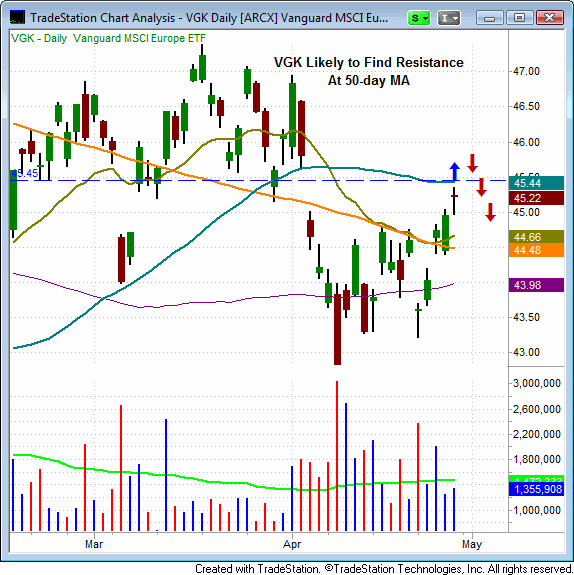
Since losing support of its 200-day MA on April 4th, the Vanguard MSCI Europe ETF (VGK) has rallied back into resistance of its 50-day MA. If VGK overcuts and forms a reversal candle at this key mark, it could present a shorting opportunity. We will be closely monitoring the price action in VGK for a possible short entry.

We opened a new long position on Friday, as VNM hit its trigger. Our open position in EPU moved above resistance of the three day high but pulled back from resistance of its recent swing high formed on April 19th. A move above $46.50 could very result in a sizeable move higher for EPU. Yesterday’s market activity was uninspiring but could be expected following a three day rally off the recent lows. We would also not be surprised to see a pullback on Monday and will be monitoring the severity of any potential selling activity as an indication of market strength.
stock commentary:
We added one new long position to the stock portfolio on Friday in UA. We like that the price action held support of the 20-day EMA after the false breakout on 4/24. If you reference a weekly chart you will see that UA bounced nicely off the 10-week MA and formed a bullish reversal candle. Our stop is just beneath the two week low, as the price action should not return to this level if the setup is to move higher in the short-term.
We have two new official setups on today’s watchlist. SWHC is listed twice due to the separate entry points above the highs of 4/25 and 4/26. The stop price is the same for both entry points. We also have DNKN listed twice with an entry over the downtrend line on the hourly chart. This setup has the same entry price with separate stops. The first stop is tight, beneath the low of 4/26. If the current breakout fails to follow through and breaks the 4/23 we wil sell half the position. The stop on the remaining half position is beneath the range low of 4/23.
If you are a new subscriber, please e-mail [email protected] with any questions regarding our trading strategy, money management, or how to make the most out of this report.