market timing model:
Confirmed Buy – Signal generated on the close of September 4 (click here for more details) (we are on a buy signal from the close of Aug. 16)
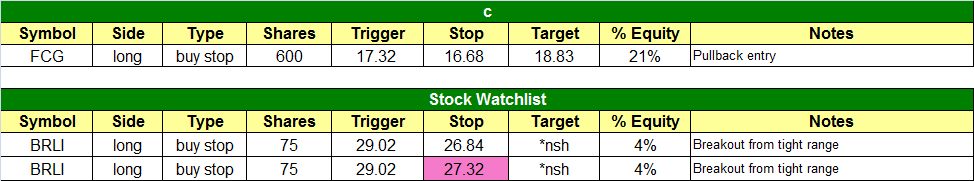
today’s watchlist (potential trade entries):
Having trouble seeing the open positions graphic above? Click here to view it directly on your web browser instead.
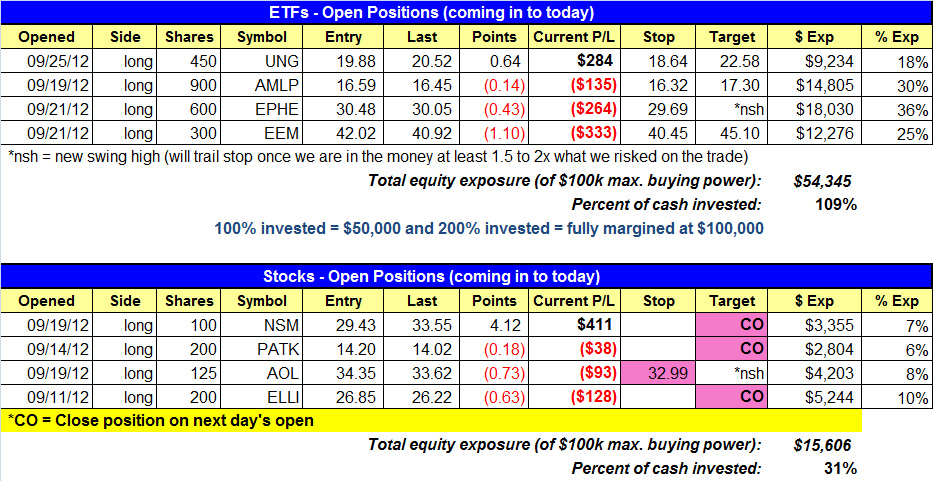
open positions:
Below is an overview of all open positions, as well as a report on all positions that were closed only since the previous day’s newsletter. Net P/L figures are based on two separate $50,000 model portfolios (one for ETFs and one for stocks). Changes to open positions since the previous report are listed in pink shaded cells below. Be sure to read the Wagner Daily subscriber guide for important, automatic rules on trade entries and exits.
Having trouble seeing the open positions graphic above? Click here to view it directly on your web browser instead.
closed positions:

Having trouble seeing the closed positions graphic above? Click here to view it directly on your web browser instead.
ETF position notes:
- FCG was added to the watchlist.
stock position notes:
- Stopped out of the full position in LNKD
- Sold partial size of AOL, NSM, and PATK.
ETF and broad market commentary:
Initially following through on the previous day’s bearish momentum, stocks trended lower throughout the first 90 minutes of trading. The broad market subsequently stabilized and attempted to edge higher for the next several hours, but the major indices drifted back down into the close. All the main stock market indexes registered losses on the day, but held above their opening lows. The Dow Jones Industrial Average ($DJIA) lost 0.3%, the S&P 500 Index ($SPX) fell 0.6%, and the Nasdaq Composite ($COMPX) receded 0.8%. The small-cap Russell 2000 Index ($RUT) and S&P Midcap 400 Index ($MID) declined 0.6% and 0.7% respectively. All the major indices closed near the middle of their intraday trading ranges.
Turnover in the NYSE edged 2% higher, while total volume in the Nasdaq was 9% lighter than the previous day’s level. Higher volume selling in the NYSE was not a positive sign for the market, but the percentage increase was nominal. Further, the Nasdaq avoided having back to back “distribution days” due to its lower trade. In both exchanges, declining volume exceeded advancing volume by a ratio of approximately 2 to 1. While market internals were negative, the moderate ADV/DEC volume ratio tells us the selling was not overly broad-based, as it was the previous day.
Presently, we are already holding a well-performing position in the US Natural Gas Fund ($UNG), which is a commodity ETF tied to the price of natural gas futures contracts. Now, we have also spotted a similar, but different, swing trade setup that we like as well. The new potential trade entry is First Trust Natural Gas ($FCG), a related ETF whose portfolio is comprised of a basket of individual natural gas stocks, rather than the actual commodity. The trade setup is shown on the weekly and daily charts of $FCG below:


Although UNG and FCG are loosely related, their chart patterns are different. Both ETFs have recently broken out above resistance of long-term downtrend lines on their weekly charts, but FCG started rallying ahead of UNG on its daily chart. UNG has been moving higher over the past two days, while FCG has been pulling back to key support near both its 50 and 200-day moving averages. Since the long-term downtrend has already been broken in FCG, the short-term pullback over the past several days now provides us with a very positive reward to risk ratio for buy entry into FCG, especially considering the major moving average support near its current closing price. As such, we have added FCG as a potential buy entry today, and our exact entry, stop, and target prices are listed on the ETF Watchlist section of the newsletter above. Notice that we will only buy FCG if it rallies above yesterday’s high, which would indicate a resumption of its established intermediate-term uptrend. As always, remember it is dangerous to “jump the gun” by buying an ETF or stock before it hits our preset trigger price.
The selling in the broad market over the past two days has pressured the individual stocks we are holding, but the effect on the prices of our ETF positions has been more muted. For example, UNG has gained nearly 5% over the past two sessions, as the S&P, Nasdaq, and Dow have all moved lower. This divergence is a good example and reminder of why we trade both individual stocks and ETFs. In healthy, steadily uptrending markets, we frequently trade more stocks than ETFs because the greater volatility of leading stocks can provide us with a greater return on capital. However, when the stock market is trending lower, chopping around in a sideways range, or entering a possible correction mode, we usually shift our focus to ETFs because the plethora of commodity, currency, fixed income, and international ETFs can still provide us with profitable swing trading opportunities. This mixture of trading both stocks and ETFs, with the ratio dependent on market conditions, enables us to maintain a smooth equity curve and helps us to achieve consistent profits year after year, regardless of market conditions.
stock commentary:
Yesterday’s follow through to the downside is sure to create plenty of doubt among traders as to whether the market can continue to trend higher the rest of the year. While the market has suffered a few distribution days, our timing model remains on a buy signal and we expect any pullback to be short-term and eventually lead to fresh buying opportunities. That being said, the key word for our style of money management is flexibility. We have no problem selling marginal winners/losers when the market begins to sell off, especially when our stocks do not act as expected. We can always re-enter positions if they setup again, but our primary concern is to control risk and reduce our long exposure so that we can think clearly.
Our scans produced a handful of decent setups that may trigger within the next few days. RGR, ULTA, BRLI, ESRX, PII, MGAM, BCOR, ALNY, ONXX, and LNKD are at the top of the list. Here are a few of the charts:


Please note that we are selling a few stocks on the open (CO order = close on open) to reduce long exposure. We also have a new stop in AOL, which is just below yesterday’s low.
If you are a new subscriber, please e-mail [email protected] with any questions regarding our trading strategy, money management, or how to make the most out of this report.
relative strength combo watchlist:
Our Relative Strength Combo Watchlist makes it easy for subscribers to import data into their own scanning software, such as Tradestation, Interactive Brokers, and TC2000. This list is comprised of the strongest stocks (technically and fundamentally) in the market over the past six to 12 months. The scan is updated every Sunday, and this week’s RS Combo Watchlist can be downloaded by logging in to the Members Area of our web site.