market timing model:
Sell – Signal generated on the close of October 12 (click here for more details)
today’s watchlist (potential trade entries):

Having trouble seeing the open positions graphic above? Click here to view it directly on your web browser instead.
open positions:
Below is an overview of all open positions, as well as a report on all positions that were closed only since the previous day’s newsletter. Net P/L figures are based on two separate $50,000 model portfolios (one for ETFs and one for stocks). Changes to open positions since the previous report are listed in pink shaded cells below. Be sure to read the Wagner Daily subscriber guide for important, automatic rules on trade entries and exits.

Having trouble seeing the open positions graphic above? Click here to view it directly on your web browser instead.
closed positions:

Having trouble seeing the closed positions graphic above? Click here to view it directly on your web browser instead.
ETF position notes:
- No trades were made.
stock position notes:
- No trades were made.
ETF and broad market commentary:
Failing to follow through on the previous day’s bullish reversal patterns, the major indices gapped sharply lower on yesterday’s open, chopped around in an indecisive range throughout the day, then eventually finished sharply lower across the board. The Nasdaq Composite ($COMPX) lost 0.9%, the S&P 500 Index ($SPX) fell 1.4%, and the Dow Jones Industrial Average ($DJIA) plunged 1.8%. Small and mid-cap stocks showed slight relative strength, as the Russell 2000 Index ($RUT) declined 0.5% and the S&P Midcap 400 Index ($MID) dropped 0.7%. The Dow closed near its low of the day, the S&P and Nasdaq finished near the middle of their intraday trading ranges, and the Russell 2000 settled at its intraday high. As we’ve noted several times in recent weeks, it was another session of divergence among the main stock market indexes.
Turnover swelled across the board, pointing to another session of distribution among banks, mutual funds, hedge funds and other institutions. Total volume in the NYSE rose 13%, while volume in the Nasdaq increased 9% above the previous day’s level. In both exchanges, trade was above 50-day average levels. In the NYSE, declining volume slammed advancing volume by a margin of more than 7 to 1. However, aided by only moderate losses in small and mid-cap issues, the Nasdaq ADV/DEC volume ratio was negative by a ratio of less than 2 to 1.
Rather than discussing individual ETF trade setups today, let’s take a concise, objective look at the technical state of the broad market. We will begin by looking at the daily chart of the S&P 500 SPDR ($SPY), a well-known ETF proxy for the benchmark S&P 500 Index:

Until yesterday, it would be fair to say that the chart pattern of SPY had not yet convincingly broken down. Rather, the index had been clinging to key intermediate-term support of its 50-day moving average. Furthermore, the “hammer” candlestick pattern that formed when on October 22 was slightly encouraging because a bullish reversal bar that coincides with an “undercut” of an obvious support level often precedes a rally. But not this time. The mere fact that SPY opened below the October 22 low in yesterday session was quite negative. Now, the 50-day moving average should act as a significant resistance level on any subsequent rally attempt. The prior lows from the previous trading range (the dashed horizontal line) will also act as a substantial area of resistance. New traders need to know the following basic tenet of technical analysis: a prior level of support becomes the new level of resistance, after the support is broken (and vice versa).
Although it is bearish that SPY now has a plethora of overhead supply and technical resistance levels to contend with, one potential ray of sunshine in the storm clouds is that SPY is now coming into major support of a year-long uptrend line. This is annotated on the longer-term weekly chart of SPY below:

The longer that a trendline has been in place, the more likely the trend will remain intact. Therefore, it is positive that SPY is now coming into support of an uptrend line that began with the lows of October 2011. If SPY is looking for an excuse to bounce from current levels, this would fit the bill. HOWEVER, with our market timing model now in “sell” mode and the daily chart pattern starting to look at bit ominous, this does NOT mean swing traders should be looking to step in and start buying stocks. Rather, we view any stock market bounce from here merely as an opportunity to dump any badly losing positions you may still be holding (shame on you if you failed to honor your protective stops). Furthermore, we will be looking to establish new short positions when the broad market starts bouncing into its new resistance levels, which would thereby create positive reward to risk ratios and low-risk entry points for selling short and/or buying inversely correlated “short” ETFs.
For the sake of brevity, we will skip analysis of the Dow Jones SPDR ETF ($DIA) because both its daily and weekly chart patterns are quite similar to SPY above (broke down firmly below its 50-day moving average yesterday, and is also coming into support of its year-long uptrend line). Instead, let’s jump to the daily and weekly charts of PowerShares QQQ Trust ($QQQ), a popular ETF that tracks the performance of the tech heavy Nasdaq 100 Index (which has been trading in similar fashion to its sibling, the Nasdaq Composite Index). Our annotated daily chart of QQQ key is below:

It takes only a quick glance at the chart above to notice that QQQ key to began breaking down well ahead of SPY, and is technically in much worse condition. In the October 8 issue of The Wagner Daily (feel free to review this issue in the archives), we provided five technical reasons we felt stocks were poised to move lower in the near to intermediate-term. One of those five reasons was the formation of a bearish “head and shoulders” pattern that was forming on the chart of QQQ key to at the time. Just one day later, QQQ began following through on the bearish pattern by slicing through its 50-day moving average. Technical analysis states the projected decline of a “head and shoulders” pattern is equal to the distance between the top of the “head’ and the “neckline.” That equated to a projected drop of approximately 4.2% at the time of our initial October 8 warning. Since then, QQQ has fallen 4.4%, which means it has fully followed-through on the projected drop of its “head and shoulders” pattern.
As for support on to QQQ, the index is now approaching major long-term support of its 200-day moving average, which is just below yesterday’s low. The last time QQQ came into support of its 200 day MA was at the beginning of June 2012, which marked the low of the correction that spanned from March through May of 2012. As for the weekly chart pattern, QQQ is now trading just below its one-year uptrend line (similar to the one shown on the weekly chart of SPY). However, support of its 200-day moving average is at least equally as important as a one-year uptrend line.
As the charts above clearly illustrate, we are now dealing with a stock market in which sentiment has clearly reversed over the past several weeks. As it is designed to do, our rule-based market timing system provided the requisite signals for us to close our long positions (other than ETFs with low correlation) and get out of the way before downside momentum really started kicking in. Now that the switch to an overall bearish sentiment has been confirmed, we are now patiently waiting for an eventual bounce in the broad market that will provide us with ideal, low-risk entry points on new short positions or inversely correlated “short” ETFs. In the coming days and weeks, we will be providing subscribers with our detailed entry, exit, and target prices of any swing trade setups that qualify.
stock commentary:
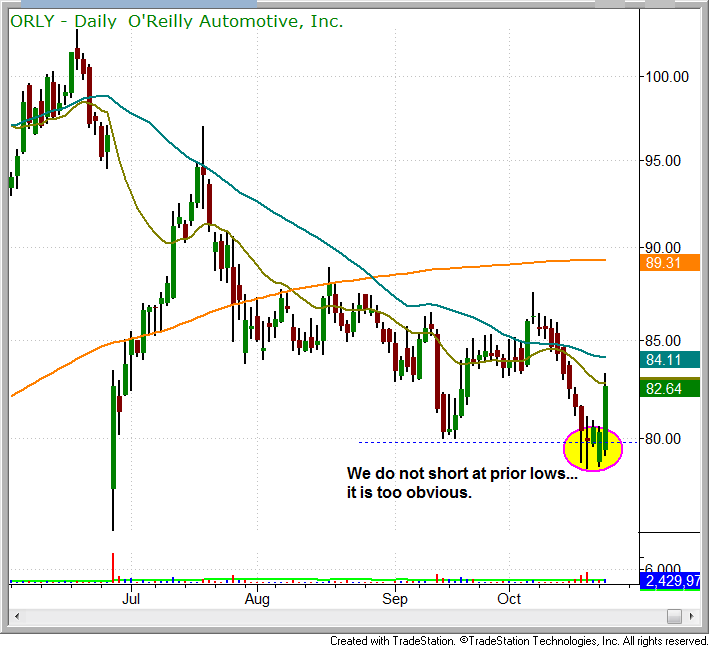
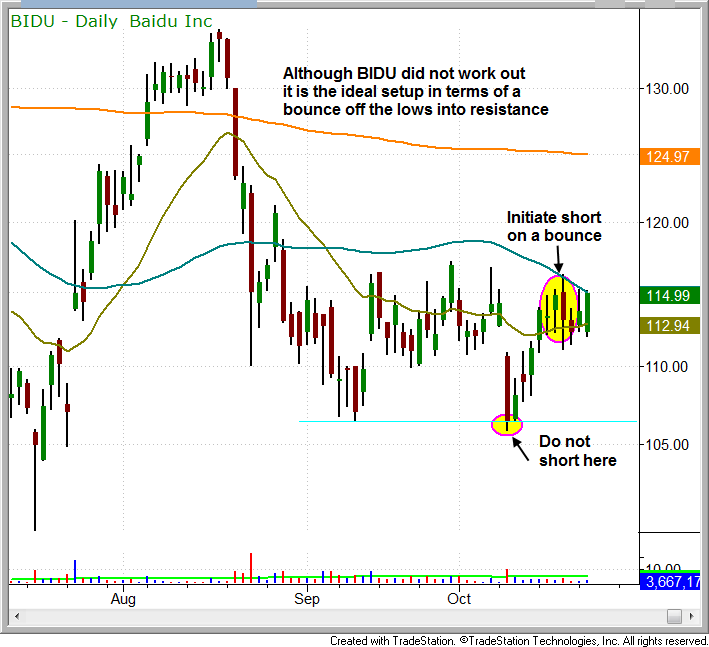
The majority of stocks we are monitoring for a short entry have either set a new swing low the past few days or are too close to a prior swing low to initiate a low risk entry. We do not short stocks that are breaking down below an obvious low, as they tend to rebound and rip higher after 1 to 2 days of weakness. Our ideal short candidate has recently set a swing low or tested a swing low and has bounced for 3 to 10 days into resistance. Although we prefer to wait for a bounce to enter a short position we do not short the bounce (to catch the high), as we always wait for confirmation in the form of a reversal bar or a gap down to signal that the short-term bounce is losing steam. We take the same approach on the long side with pullback buys, as we never buy the pullback to catch the bottom, we always wait for the pullback to stall out and form some sort of reversal bar before we enter.
The chart of ORLY below is an example of shorting an obvious breakdown, which for the most part is something we are not very comfortable doing:

The recent bounce in BIDU is a good example of what we are looking for:

The short-term plan is to remain patient and wait for low risk short setups to emerge. Due to the recent breakdown in the market we are not even looking at long setups right now. The market has simply deteriorated too much for our liking.
If you are a new subscriber, please e-mail [email protected] with any questions regarding our trading strategy, money management, or how to make the most out of this report.
relative strength combo watchlist:
Our Relative Strength Combo Watchlist makes it easy for subscribers to import data into their own scanning software, such as Tradestation, Interactive Brokers, and TC2000. This list is comprised of the strongest stocks (technically and fundamentally) in the market over the past six to 12 months. The scan is updated every Sunday, and this week’s RS Combo Watchlist can be downloaded by logging in to the Members Area of our web site.