Current signal generated on close of Feb. 3.
Portfolio exposure can be anywhere from 0% to 60% long (or more), depending on how open positions have held up.
Past signals:
Neutral signal generated on close of January 24.
- Buy signal generated on close of November 13
- Buy signal generated on close of September 9
- Neutral signal generated on close of August 15
- Buy signal generated on close of July 11
- Neutral signal generated on close of July 5
- Sell signal generated on close of June 24
today’s watchlist (potential trade entries):

Having trouble seeing the open positions graphic above? Click here to view it directly on your web browser instead.
Below is an overview of all open positions, as well as a report on all positions that were closed only since the previous day’s newsletter. Changes to open positions since the previous report are listed in pink shaded cells below. Be sure to read the Wagner Daily subscriber guide for important, automatic rules on trade entries and exits.

Having trouble seeing the open positions graphic above? Click here to view it directly on your web browser instead.
closed positions:
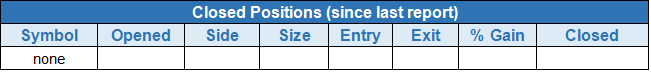
Having trouble seeing the closed positions graphic above? Click here to view it directly on your web browser instead.
ETF position notes:
- No trades were made.
stock position notes:
- No trades were made.
ETF, stock, and broad market commentary:
After undercutting Monday’s low in the opening hour, most averages rebounded nicely to close near the highs of the session. The reversal action in the Nasdaq also undercut the swing low of December before closing more than 1.2% off the lows of the day.
Volume ticked higher on the Nasdaq, but was slightly lower on the NYSE. It was a constructive day for the S&P 500 and Nasdaq Composite IF Wednesday’s low is able to hold up through the end of the week.
In tomorrow’s report we will cover short setups in stock/ETFs that are in a strong downtrend and trading near 52-week lows.
A push through Wednesday’s high in the major averages could spark a relief rally of several weeks or more, which would flesh out the right side of a potential head and shoulders pattern forming on the daily S&P 500.
Agriculture ETFs are heating up, led by an explosive move in Coffee ($JO), while Cocoa ($NIB) is at new 52-week highs after several weeks of basing action (though it doesn’t trade much volume).
Powershares DB Agriculture Fund ($DBA), which has about 11% exposure to Coffee and Cocoa, has also made an impressive move off the lows, breaking through the 40-week MA on big volume so far this week.
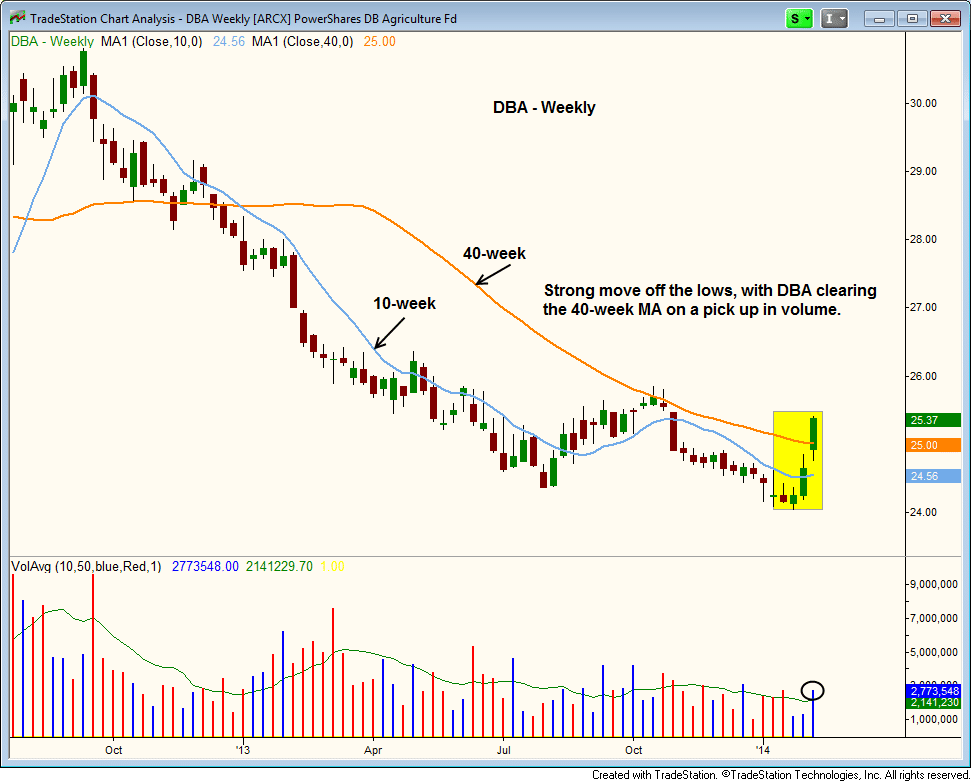
$DBA is too far extended for a low-risk entry point, but we will continue to monitor the action as we wait for a 4-5 base to form above the 40-week MA.
We’d also like to see the 10-week MA climb above the 40-week MA, and for the 40-week MA to turn up.
The monthly chart below shows that $DBA could possibly stall out above $26, as there is resistance from a prior swing low and a weekly downtrend line. The ideal price action over the next several weeks in $DBA is to break the downtrend line on heavy volume, and then base out for several weeks above $26 (forming a bull flag like pattern on the weekly chart)
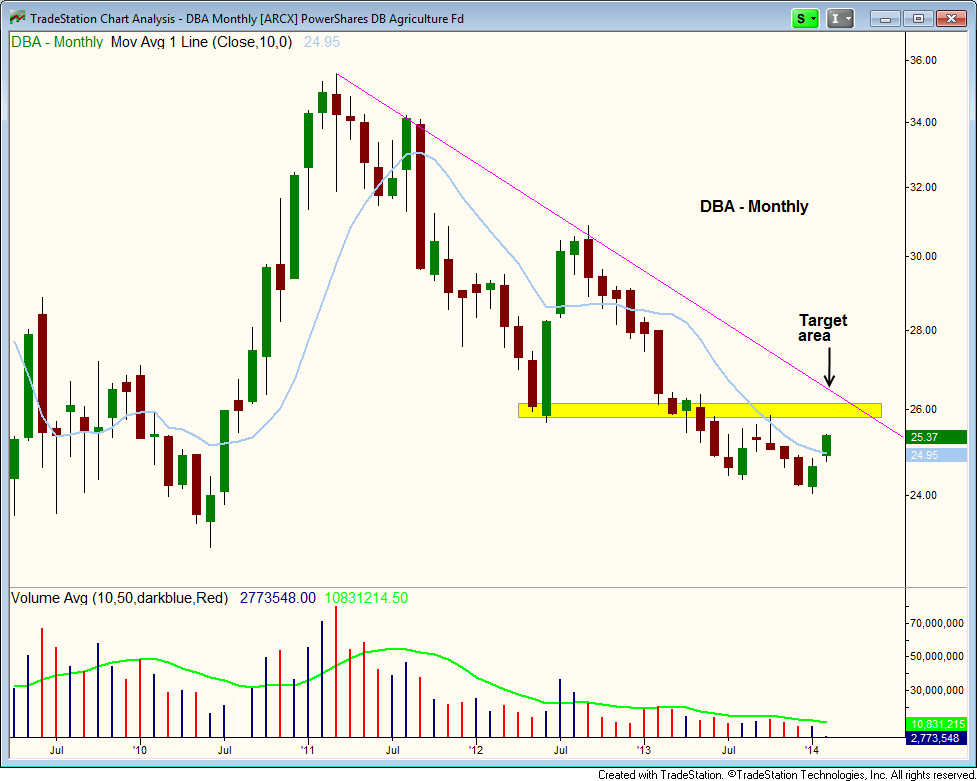
Again, its much too early to enter $DBA, but it is certainly one to watch.
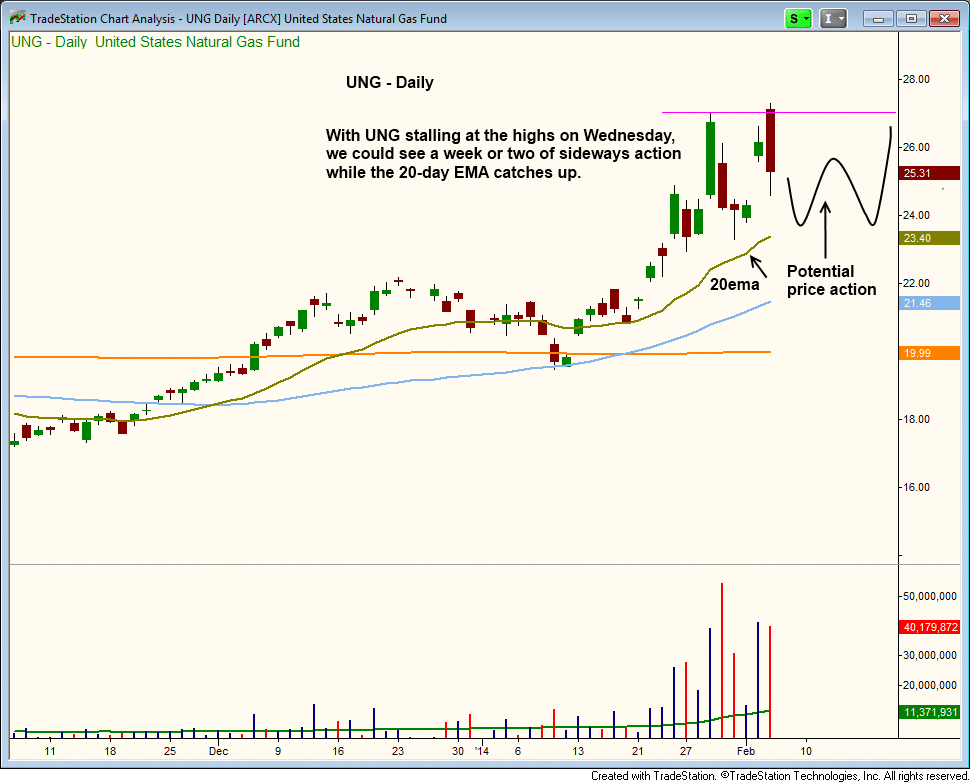
Natural Gas ETF ($UNG) stalled out at the prior highs, failing to clear $27 for the third time in 6 sessions. The stalling action should lead to a few weeks of consolidation above $23, which would allow the 20-day EMA to catch up. A test of the 23.50 – 24.00 level may provide us with another chance to add to the position on weakness.
Reminder, $LNKD reports earnings after the close tomorrow, so if you are not comfortable holding, please exit the position before the close.
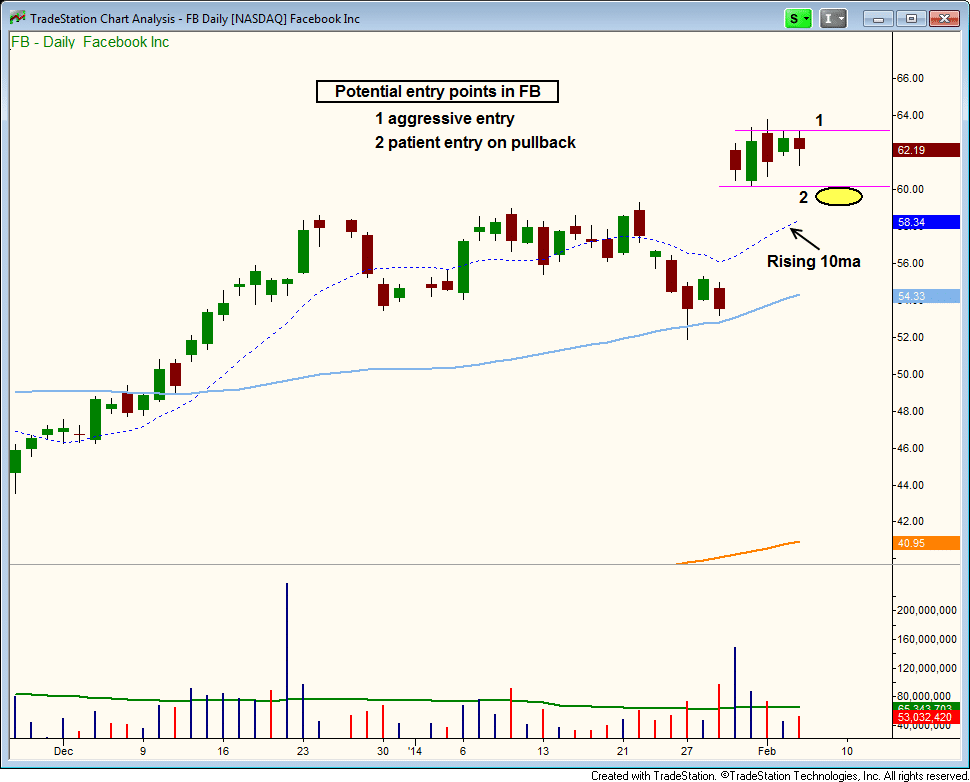
We have one new buy setup on today’s watchlist in $FB. There are two potential entry points in $FB (in our opinion).
An aggressive entry is on a breakout above the two-day high. If the breakout in $FB coincides with the market breaking above Wednesday’s high, then we could see a decent advance in $FB as the market bounces from oversold conditions.
A pullback entry is also a possibility, if the price action sells off to the rising 10-day MA, which could be somewhere around the $59 – $60 area.
We are going with the breakout entry scenario today. Our size is small at only 25%. Since this is a G.O.N.G. setup, which means go or no go, the stop is fairly tight. If the setup triggers and fails right away, then we can look to re-enter a little lower off the rising 10-day MA.
We intentionally left the paragraph below up from yesterday’s report to make sure subscribers understand how the timing model functions.
A quick note on the timing model. Just because we are on a sell signal does not mean that we can’t buy stocks or ETFs. Our timing model is a guide, not a set of concrete rules. That being said, we know that when in sell mode, establishing 3-5 new positions in a week without any improvement in the model is a bit too risky. However, adding 1 or 2 new positions with light size is fine.