market timing model: (Confirmed) Buy
Current signal generated on close of September 9.We are now in confirmed buy mode, so portfolio exposure can be more than 100% if you have a marginable account. However, please make sure that current long positions in your portfolio are working before adding new ones. Portfolio exposure should be at least 75% to 100% (or more) right now.Past signals:
- Neutral signal generated on close of August 15
- Buy signal generated on close of July 11
- Neutral signal generated on close of July 5
- Sell signal generated on close of June 24
today’s watchlist (potential trade entries):

Having trouble seeing the open positions graphic above? Click here to view it directly on your web browser instead.
open positions:
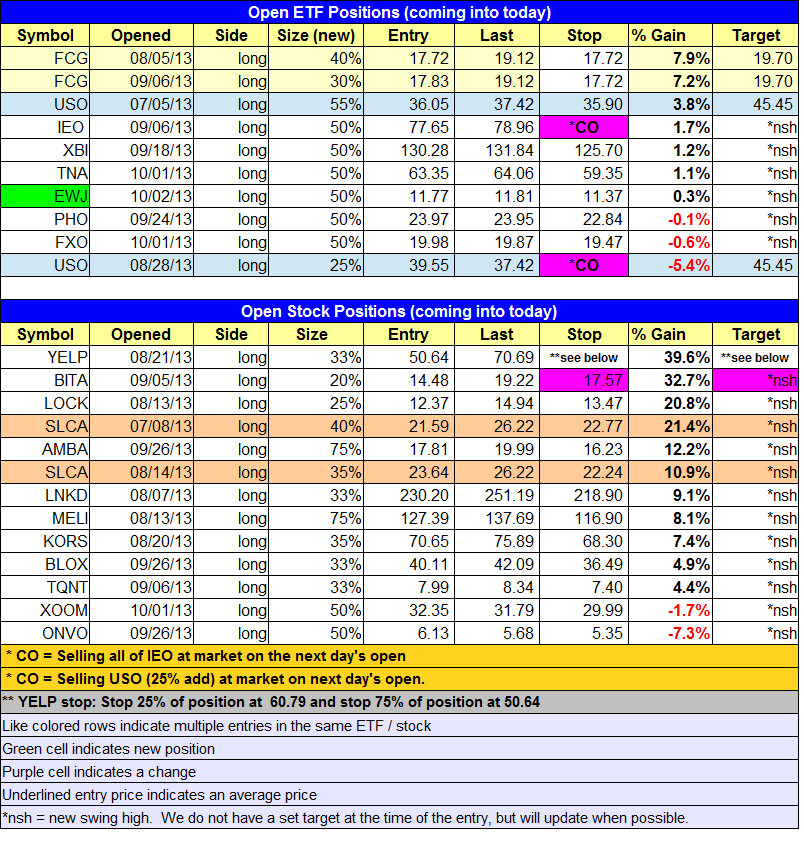
Below is an overview of all open positions, as well as a report on all positions that were closed only since the previous day’s newsletter. Changes to open positions since the previous report are listed in pink shaded cells below. Be sure to read the Wagner Daily subscriber guide for important, automatic rules on trade entries and exits. Click here to learn the best way to calculate your share size.
Having trouble seeing the open positions graphic above? Click here to view it directly on your web browser instead.
closed positions:

Having trouble seeing the closed positions graphic above? Click here to view it directly on your web browser instead.
ETF position notes:
- $EWJ buy entry triggered on the open. Please note that we are selling the add in $USO on the open due to significant overhead. We will continue to hold the 55% position with a near break-even stop. We are selling $IEO on the open to make room for $PPA, as we aleady have a decent amount of energy exposure. $PPA is a market on open buy order (5-minute rule and 1.3% gap rule will not apply).
stock position notes:
- No trades were made.
ETF, stock, and broad market commentary:
Stocks closed in negative territory across the board, but the losses were minimal, as all major averages closed well off the session lows. The S&P 500 bounced off support of the 50-day MA and closed near the highs of the day, while the Dow Jones recovered nicely after undercutting the two-day low during the first 90-minutes of trading.
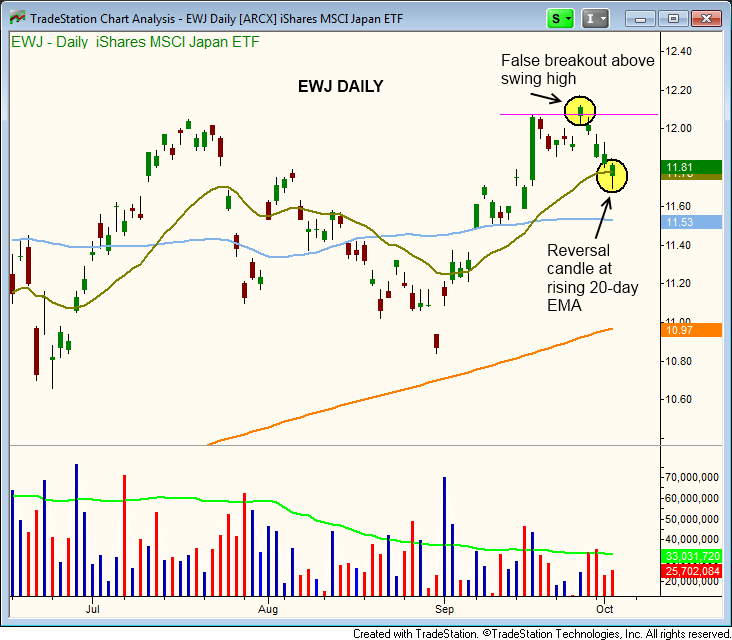
We established a long position yesterday in iShares MSCI Japan Index ($EWJ) on a dip into support of the rising 20-day EMA. As anticipated, the price action was able to find support at the moving average, and closed near the highs of the day.
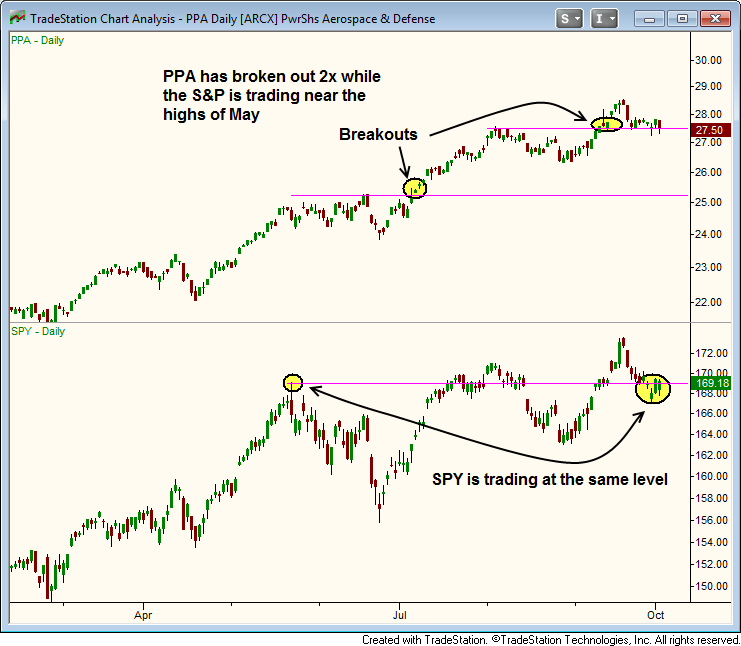
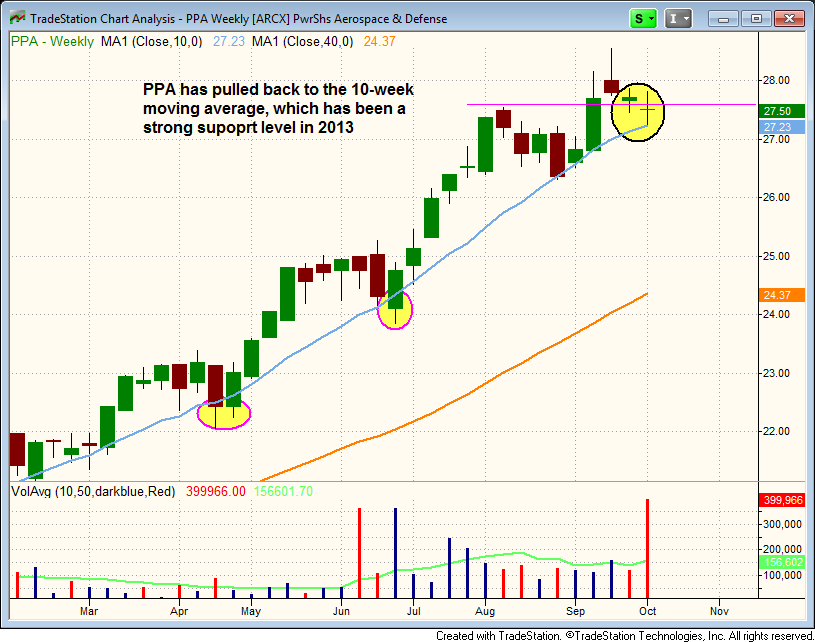
Over the past few months, PowerShares Aerospace & Defense ($PPA) has shown great relative strength vs. the S&P 500. The chart below shows $PPA breaking out twice over the past few months, setting higher highs and higher lows while the S&P 500 has basically gone nowhere.
After breaking out to new highs three weeks ago, $PPA has pulled back to support of the rising 10-week MA, which has held up all year during every pullback. Looking at the weekly chart below, the recent pullback presents us with a low risk entry point, as the price action should hold at or around this level over the next week or two before the uptrend resumes. We are placing $PPA on today’s buy watchlist (trade details can be found above).
Claymore/AlphaShares China Small Cap ($HAO) has bounced back nicely after finding support at the weekly downtrend line on both pullbacks in the current base. When a stock/ETF breaks a downtrend line and fails to move out immediately, we typically see a few weeks of base building. If the price action within the base is very bullish, the correction will be shallow and tight. With $HAO, the correction was not shallow, but it did manage to hold above the downtrend line on two tests just below $22, which is a good sign. Since the second touch of the downtrend line, $HAO has reclaimed the 10-week and 40-week MAs, and the 10-week MA has recently crossed above the 40-week MA, which is a bullish trend reversal signal.
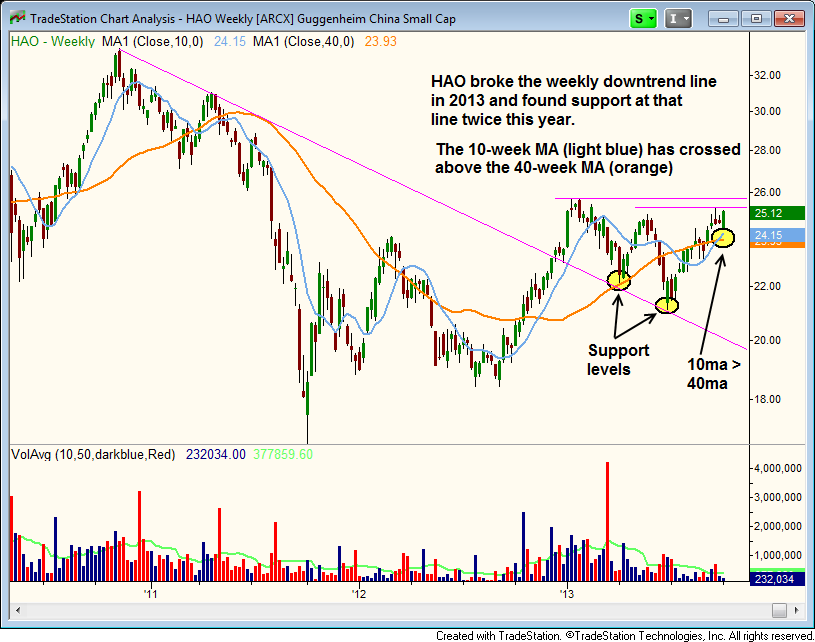
Although $HAO is not an official buy entry, a breakout above the $25 and $26 levels could spark the next wave up with a target around the $29 – $30 area.
Please note that we raised stop in $BITA and canceled the $19.95 target. With a little luck, we might be able to hold on for a bigger move than expected. If not, our stop below Wednesday’s low locks in a decent 20% gain.
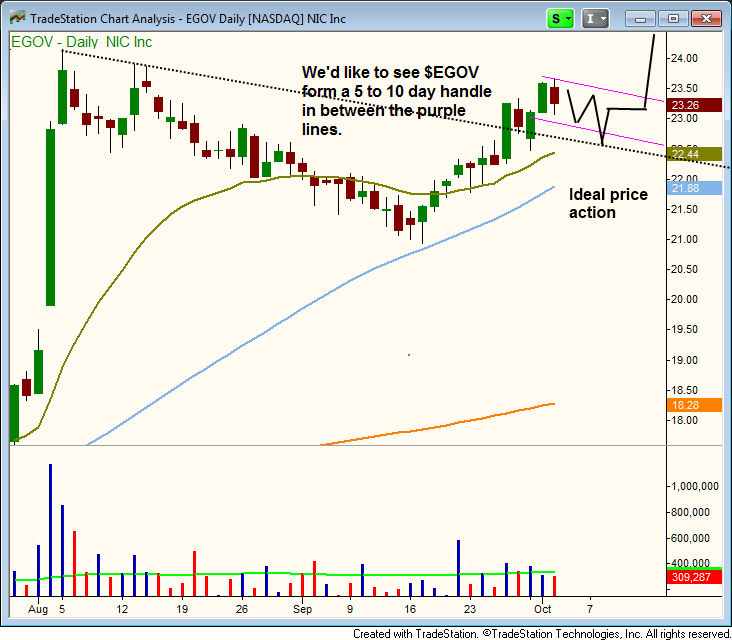
We are stalking $EGOV for an entry point and would like to see the price action handle out here for the next week or two. A handle is simply a tight range of action over a few weeks that slopes lower. We want to see one or two days where the price action shakes out the longs with some sort of reversal candle or undercut of a prior low. The ideal price action is drawn on the daily chart below, but as you know, the stock will go where it wants to go. $EGOV is pretty solid technically and fundamentally, as it has an 88 RS ranking and a 99 EPS ranking (from IBD website). The quarter over quarter earnings have jumped significantly the past few quarters, coming in at 63%, 67%, and 78%.
