market timing model:
Confirmed Buy – Signal generated on the close of September 4 (click here for more details) (we are on a buy signal from the close of Aug. 16)
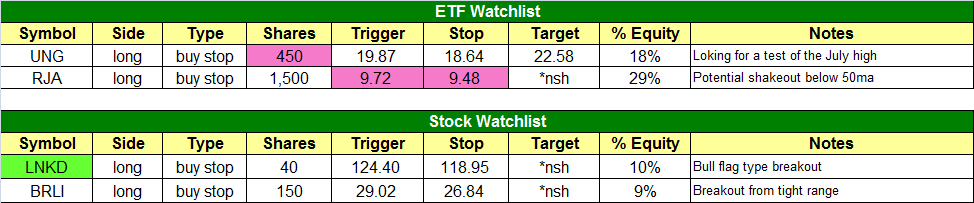
today’s watchlist (potential trade entries):
Having trouble seeing the open positions graphic above? Click here to view it directly on your web browser instead.
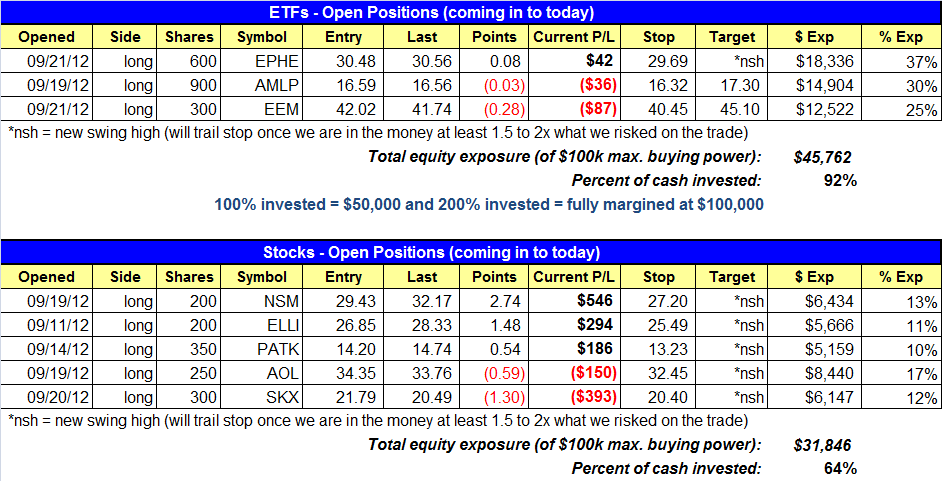
open positions:
Below is an overview of all open positions, as well as a report on all positions that were closed only since the previous day’s newsletter. Net P/L figures are based on two separate $50,000 model portfolios (one for ETFs and one for stocks). Changes to open positions since the previous report are listed in pink shaded cells below. Be sure to read the Wagner Daily subscriber guide for important, automatic rules on trade entries and exits.
Having trouble seeing the open positions graphic above? Click here to view it directly on your web browser instead.
closed positions:

Having trouble seeing the closed positions graphic above? Click here to view it directly on your web browser instead.
ETF position notes:
- Note the increase in share size to the UNG setup.
stock position notes:
- We remain long SKX (see stock commentary below for a detailed explanation).
ETF and broad market commentary:
Following through on last Friday’s weak closing price action, the broad market gapped lower on yesterday’s open. However, stocks quickly stabilized and traded in a choppy, sideways range throughout the first half of the day. Buyers stepped into the market in the final two hours of trading, enabling the major indices to move to new intraday highs and trim their closing losses. Both the S&P 500 Index ($SPX) and Dow Jones Industrial Average ($DJIA) settled 0.2% lower, while the Nasdaq Composite ($COMPQ) lost 0.6%. The small-cap Russell 2000 Index ($RUT) and S&P MidCap 400 Index ($MID) slipped 0.4% and 0.2% respectively. All the main stock market indexes closed in the upper third of their intraday highs.
Volume fell substantially across the board, which was not surprising given that the previous day’s session was quarterly “quadruple witching” options expiration day. Turnover in the NYSE eased 35%, as total volume in the Nasdaq receded 27% below the prior day’s level. Even factoring out last Friday’s volume spike that was due to options expiration, trade in the NYSE was still below its 50-day average level. Nasdaq volume was only fractionally higher than average. Therefore, it’s safe to say that yesterday was not a “distribution day,” which would’ve been indicative of institutional selling. As for market internals, declining volume exceeded advancing volume in the Nasdaq by a margin of just over 3 to 1, but the NYSE ADV/DEC volume ratio was only negative by a ratio of just over 3 to 2.
One not so obvious situation we observed in yesterday session was the relative strength in international ETFs. In the September 21 issue of The Wagner Daily, we discussed that international ETFs, particularly those of emerging markets, were starting to show signs of bullish price momentum. That initial observation is now being manifested by the fact that all the ETFs we discussed that day managed to close slightly higher in yesterday’s session, despite the losses in the S&P 500 and Nasdaq. The iShares Philippines Index ($EPHE), which we bought in our model ETF portfolio on September 21, gained 0.8% yesterday. The other international ETF we bought the same day, iShares Emerging Markets ($EEM), managed to eke out a gain of 0.1%. The iShares Hong Kong Index ($EWH) and iShares Mexico Index ($EWW), both of which have also been on our radar screen over the past several days, rose 0.3% and 0.2% respectively.
The increasing relative strength we are starting to see in emerging markets ETFs is positive not only for our open positions, but as a sign for the overall health of the broad market as well. If money is rotating into these ETFs, we view it as an indication of increasing appetite for risk amongst market participants, just as relative strength in the small-cap stocks is typically a positive sign for the broad market. In case you missed our initial entries into EPHE and EEM last Friday, either ETF could be bought near yesterday’s closing prices, as both ETFs are still trading within only about ten cents of our initial entry prices. We also like the current pattern in EWW, which is shown on the daily chart below:

EWW, which is trading near its all-time high, has gently pulled back from its “swing high” of September 14, and is holding above new horizontal price support of its prior breakout level, as well as its 20-day exponential moving average. The ETF also formed a bullish reversal candle yesterday by gapping lower on the open, then reversing to close positive and near its intraday high. With this pattern, EWW could be considered for buy entry just above yesterday’s high, with a stop below the 20-day exponential moving average. This would provide one with a positive reward to risk ratio on the trade. However, because we already have exposure to two different international ETFs in our model ETF portfolio, we are not listing EWW as an “official” trade setup in today’s newsletter.
stock commentary:
Note: Yesterday afternoon we sent out a courtesy alert stating that SKX triggered our stop at 20.44. The official stop price was 20.40 and the low of the day was 20.43, so we did not stop out of SKX and remain long. For those who sold SKX, please re-enter IF the price action opens above our stop (20.40) on Tuesday. If SKX opens at or below our stop there is no need to re-enter because we will have officially stopped out. Sorry for the confusion, and I apologize for the error.
LNKD continues to trade in a tight range, forming a bull flag type consolidation at the highs. We are taking a half position on LNKD and looking for a 15-20% move once the uptrend resumes.

With a little help from the market we may be able to book some decent gains in stocks like NSM, PATK, and ELLI within the next 5 to 10 trading days. We removed GNC and REGN from the watchlist. REGN is starting to look more like a consolidation than a pullback entry at this point; however, if REGN can clear today’s high and put in a higher low sometime next week it could possibly return to the watchlist. REGN also reports earnings in mid-October, so the timing of the next potential breakout might be a little tricky.
If you are a new subscriber, please e-mail [email protected] with any questions regarding our trading strategy, money management, or how to make the most out of this report.
relative strength combo watchlist:
Our Relative Strength Combo Watchlist makes it easy for subscribers to import data into their own scanning software, such as Tradestation, Interactive Brokers, and TC2000. This list is comprised of the strongest stocks (technically and fundamentally) in the market over the past six to 12 months. The scan is updated every Sunday, and this week’s RS Combo Watchlist can be downloaded by logging in to the Members Area of our web site.