Commentary:
Following a strong morning gap up, stocks closed higher yesterday, but for the most part off session highs. The exceptions were small and mid cap stocks, which closed near session highs. The major indices all closed higher, with the small-cap Russell 2000 and the S&P MidCap 400 leading the advance. By session’s end the small-cap Index added 1.5% while the S&P MidCap 400 improved by 1.3%. The Nasdaq, S&P 500 and Dow Jones Industrial Average posted gains of 1.0%, 0.9% and 0.6% respectively.
For the second time in as many sessions, market internals were bullish. Turnover quickened on the Nasdaq by a modest 1.8%, while on the NYSE it improved by an impressive 16.4%. The ratio of advancing volume to declining volume ended the day at a plus 4.1 to 1 on the NYSE and a plus 3.1 to 1 on the Nasdaq. Tuesday was a clear accumulation day across the board, as both exchanges posted solid gains on higher advancing volume. Institutions were in purchase mode on Tuesday.
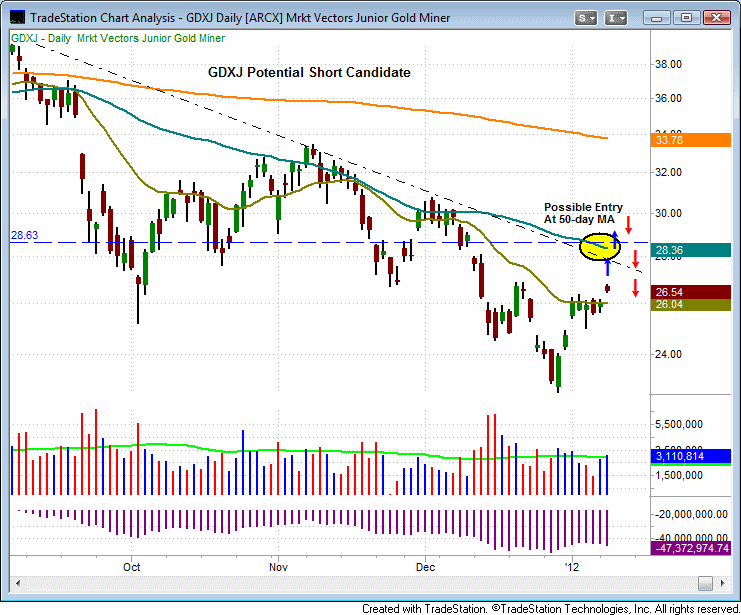
Although we currently hold a bullish bias, the Market Vectors Junior Gold Miners ETF (GDXJ) could present a shorting opportunity under the right circumstances. Since bottoming on December 29th, this ETF has rallied back above resistance of its 20-day EMA. Given the current bullish market conditions, we would only consider this short if it rallies, overcuts and stalls near the 50-day MA. This level also corresponds with the long term down trend line (see chart). Please note, that for the moment, we are not inclined to be aggressive on the short side of the market. Market conditions would have to shift significantly for our bias to become bearish.

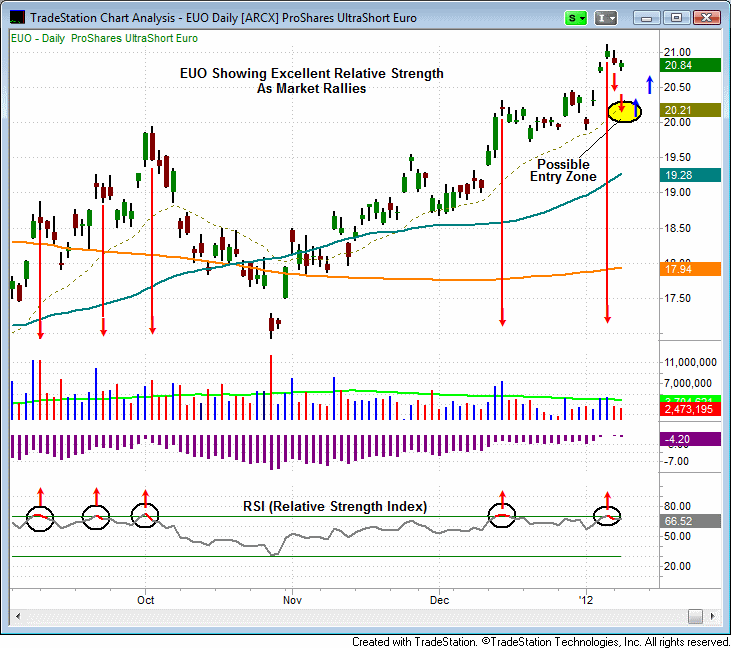
The ProShares UltraShort Euro (EUO) has been showing relative strength during the recent rally in the market. Typically, when the US markets Rally, EUO come under significant selling pressure. This is due to the fact that there is an inverse relationship between the stock market and the US dollar. When the market rallies, the dollar falls and this would normally result in EUO dropping (because Euro gets stronger when dollar falls). This inverse ETF could present a long entry into a pullback and undercut of the 20-day EMA. Notice how precisely the Relative Strength Index (EUO) has provided overbought signals every time EUO has seen a strong rally. The relative strength index is defined as follows:
The Relative Strength Index or RSI is a technical momentum indicator that compares the magnitude of recent gains to recent losses in an attempt to determine overbought and oversold conditions of a stock or ETF. An asset is deemed to be at an extreme (overbought) once the RSI approaches or crosses the 70 level, meaning that it may be getting overvalued and is a good candidate for a pullback. Likewise, if the RSI approaches 30, it is an indication that the asset may be getting oversold and therefore may be ready for a bounce. RSI can also help identify turning points when there are non-confirmations or divergences. For example, a new high in price without a new high in RSI may indicate a false breakout. In most software programs, this indicator automatically changes the color of the RSI line when it exceeds either of the levels specified in the inputs oversold and overbought (30 and 70 respectively). Horizontal lines are plotted at these levels as visual aids in most software.

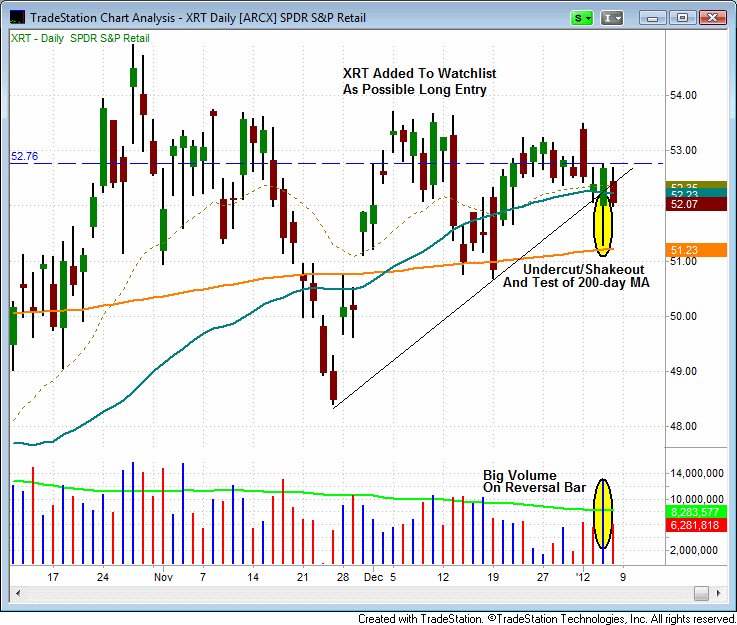
Because of the gap-up yesterday, neither of our watchlist setups triggered. We sent an intraday alert cancelling the IWB trade and moved the trigger price higher on XRT. Our open position in IYT held up well yesterday but IYZ has show a bit less strength. We may increase the stops on both of these trades depending on their respective price action on Wednesday. For our subscribers, new trade details for XRT are posted in the watchlist section of the newsletter. Although yesterday’s rally was reasonably bullish, it was fueled by significant “bottom fishing”. Of the 297 industry groups that we track, the seven highest finishers on the day were from the bottom ten percent of these industry groups. This tells us that laggards were leading the market higher. However, strong stocks have fared well as of late and this is the price confirmation we have been looking for. We wouldn’t be surprised to see a modest pullback on Wednesday. If the market is strong we should continue to see buying on any pullbacks.
Today’s Watchlist:

XRT
Long
Shares = 250
Trigger = 53.21
Stop = 51.17
Target = 55.50 – 56.00 area (will send alert)
Dividend Date = n/a
Notes = see commentary from Jan. 9
Daily Performance Report:
Below is an overview of all open positions, as well as a performance report on all positions that were closed only since the previous day’s newsletter. Net P/L figures are based on the $50,000 Wagner Daily model account size. Changes to open positions since the previous report are listed in red text below. Please review the Wagner Daily Subscriber Guide for important, automatic rules on trigger and stop prices
- DUST and IWB were removed from the watchlist. Note the new trigger price in XRT.
- Reminder to subscribers – Intraday Trade Alerts to your e-mail and/or mobile phone are normally only sent to indicate a CHANGE to the pre-market plan that is detailed in each morning’s Wagner Daily. We sometimes send a courtesy alert just to confirm action that was already detailed in the pre-market newsletter, but this is not always the case. If no alert is received to the contrary, one should always assume we’re honoring all stops and trigger prices listed in each morning’s Wagner Daily. But whenever CHANGES to the pre-market stops or trigger prices are necessary, alerts are sent on an AS-NEEDED basis. Just a reminder of the purpose of Intraday Trade Alerts.
- For those of you whose ISPs occasionally deliver your e-mail with a delay, make sure you’re signed up to receive our free text message alerts sent to your mobile phone. This provides a great way to have redundancy on all Intraday Trade Alerts. Send your request to [email protected] if not already set up for this value-added feature we provide to subscribers.

Having trouble seeing the position summary graphic above?
Click here to view it directly on your Internet browser instead.
Notes:
Edited by Deron Wagner,
MTG Founder and
Head Trader