sell
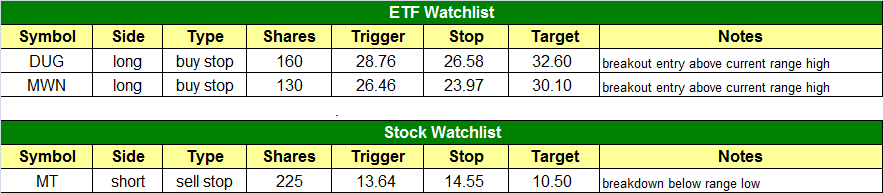
today’s watchlist (potential trade entries):
open positions:
Below is an overview of all open positions, as well as a report on all positions that were closed only since the previous day’s newsletter. Net P/L figures are based on two separate $50,000 model portfolios (one for ETFs and one for stocks). Changes to open positions since the previous report are listed in red shaded cells below. Be sure to read the Wagner Daily subscriber guide for important, automatic rules on trade entries and exits.
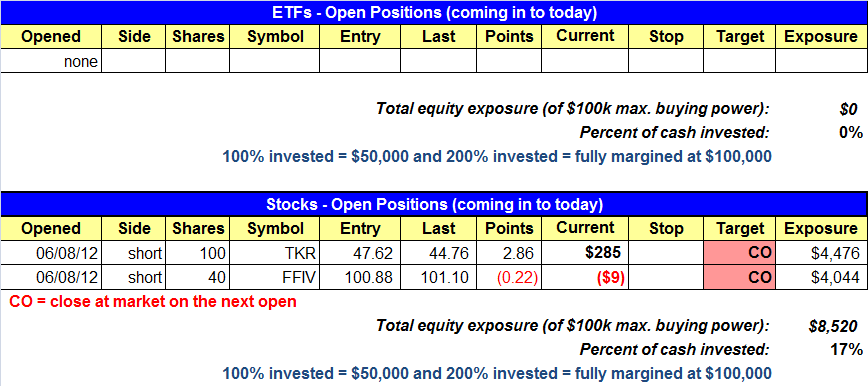
Having trouble seeing the open positions graphic above? Click here to view it directly on your web browser instead.
closed positions:
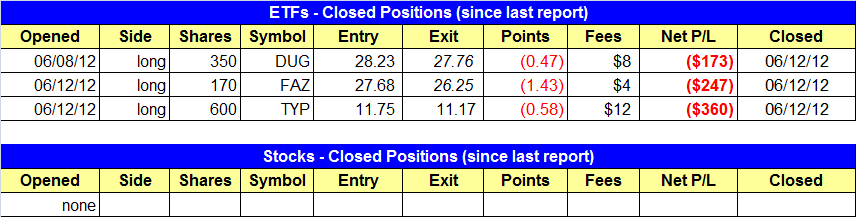
Having trouble seeing the closed positions graphic above? Click here to view it directly on your web browser instead.
ETF position notes:
- DUG, TYP, and FAZ triggered their protective stops and we are out.
stock position notes:
- No trades were made.
ETF and broad market commentary:
Stocks back peddled on Wednesday on mixed trade. After recovering from an opening gap down, stocks rallied and appeared to be gaining some traction. However, sellers stepped into the market late in the session and drove stocks lower. All five of the major indices ended the day in the bottom third of their respective intraday ranges. The S&P MidCap 400 dropped 1.4%, as it undercut the low of the five day trading range. The mid-cap index now appears headed for a retest of its June 4th swing low. The small-cap Russell 2000 is also in danger of losing support of its five day trading range low. A move below 748 could place this index under serious pressure. The Nasdaq, S&P 500 and Dow Jones Industrial Average tumbled 1.0%, 0.7% and 0.6% respectively.
For the second time this week, market internals were mixed. Volume climbed 1.5% on the Nasdaq but slid 2.7% on the NYSE. Down volume outpaced up volume by a ratio of 2.8 to 1 on the NYSE and 2.3 to 1 on the Nasdaq. Yesterday’s late round of higher volume selling resulted in a distribution day for the Nasdaq. However, for a second straight day, there was less institutional presence on the NYSE, as volume was light.
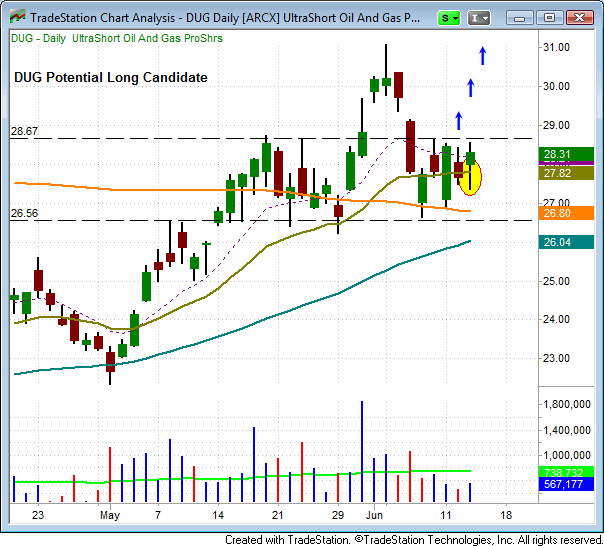
As we’ve stated many times in the newsletter, “each trade stands of its own merits.” With this in mind, we are placing the ProShares UltraShort Oil and Gas ETF (DUG) back on the watchlist. DUG formed a bullish reversal candle yesterday, as it undercut its 20-day MA but then rallied to close near session highs. Also, DUG formed the reversal candle on an uptick in volume. A move above the June 8th high of $26.87 could provide a buy entry trigger for this inverse ETF. Trade details are posted in the watchlist segment of the newsletter.
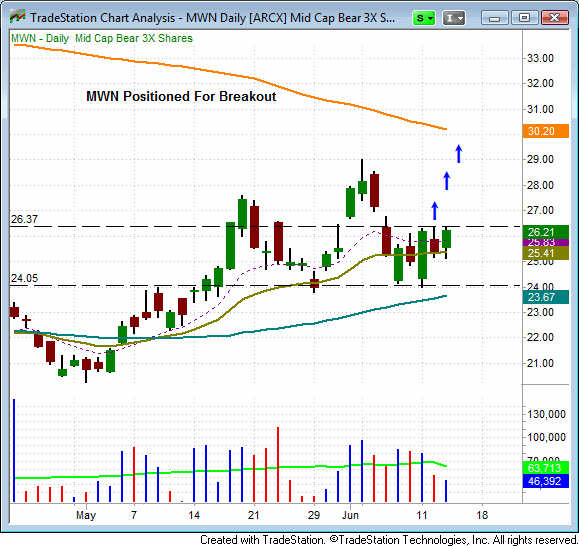
Over the past week, the S&P MidCap 400 has shown relative weakness to the other major indices. Yesterday, this index was the only one of the five to momentarily lose support of its five day low. By extension, the Direxion Mid Cap Bear 3x ETF (MWN) has shown relative strength to the other inverse ETF indices. A move above the five day high of $26.37 could provide a buy entry trigger for this inverse ETF. We are placing MWN on the watchlist. You will find trade details for MWN in the watchlist section of the newsletter.
As planned, we exited partial size in FAZ, DUG and TYP at the market, on the open yesterday. We also stopped out of the remaining shares in all three positions as the market attempted to break out to new intraday highs just after 11am. Yesterday provided another see-saw session for Wall Street. Given the late session price action, we are now prepped for a potential move lower in the broad market. Small and mid cap stocks appear to be under the most pressure. Nonetheless, it is important to remember that we remain only one day removed from a potential buy signal in the market.
stock commentary:
We are exiting TKR and FFIV at market on the open. If TKR opens near yesterday’s close we will make a modest $200 gain and FFIV should be a scratch.
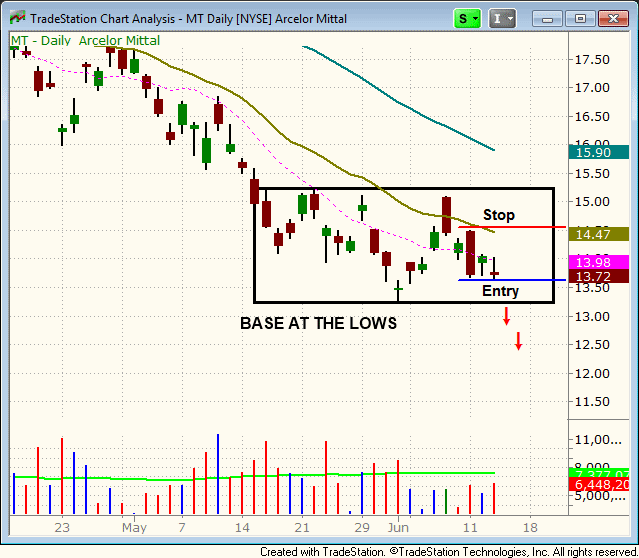
MT just broke through four years of support at $15.00 in late May. The short entry is just beneath the 6/11 low (see trade details in watchlist).
Top long candidates we are monitoring: LQDT AFFY AVD CHSI REGN AMLN CRAY SWI LF EQIX HSTM WWWW MDSO SXCI VVUS ALXN CERN ATHN EBAY
If you are a new subscriber, please e-mail [email protected] with any questions regarding our trading strategy, money management, or how to make the most out of this report.
relative strength watchlist:
Our Relative Strength (or RS) Watchlist makes it easy for subscribers to import data into their own scanning software, such as Tradestation, Interactive Brokers, and TC2000. This list is comprised of the strongest 100 (or so) stocks in the market over the past six to 12 months. The scan is updated every Sunday, and this week’s RS Watchlist can be downloaded by logging in to the Members Area of our web site.