today’s watchlist (potential trade entries):

open positions:
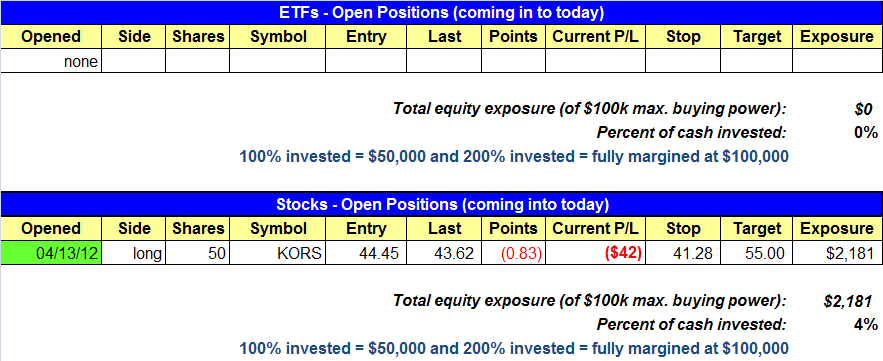
Below is an overview of all open positions, as well as a report on all positions that were closed only since the previous day’s newsletter. Net P/L figures are based on two separate $50,000 model portfolios (one for ETFs and one for stocks). Changes to open positions since the previous report are listed in red text below. Be sure to read theWagner Daily subscriber guide for important, automatic rules on trade entries and exits.

Having trouble seeing the open positions graphic above? Click here to view it directly on your web browser instead.
closed positions:

Having trouble seeing the closed positions graphic above? Click here to view it directly on your web browser instead.
ETF position notes:
- No trades were made.
stock position notes:
- Per intraday alert, bought small size (5% position) in KORS over the high of April 11. This is a starter position, so if the price action holds above the 50-day MA and the market improves we will hold for several weeks. If the action fails to hold the 50-day MA, then we may cut the position ahead of our stop.
ETF and broad market commentary:
Stocks lost ground on Friday, on higher volume. The major indices all fell more than one percent, with the higher beta exchanges leading the decline. The small-cap Russell 2000 and the Nasdaq both plunged 1.5%, while the S&P MIdCap 400 and the S&P 500 both slid by 1.3%. The Dow Jones Industrial Average showed the most resiliency but still closed lower by 1.1%.
Market internals were bearish on Friday. Volume increased on both the NYSE and the Nasdaq by 0.75%. Further, declining volume topped advancing volume by 6 to 1 on both exchanges. The decline in price action accompanied by higher volume and higher declining volume suggests that institutions continue to place selling pressure on the market.
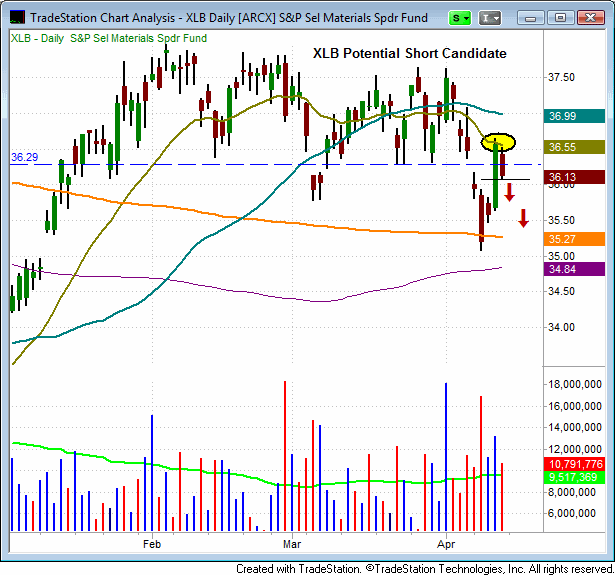
Over the past two sessions, the S&P Select Materials SPDR Fund (XLB) has found resistance at its declining 20-day EMA. XLB also have considerable resistance at $36.30. A move below Friday’s low of $36.10 could present a shorting opportunity in this ETF.

On April 4th, the S&P Select Industrial SPDR Fund (XLI) lost support of its 20-day EMA and 50-day MA. Since then, XLI set a lower low on April 10th. XLI now faces resistance at its 20 and 50 day moving averages and offers a possible short entry on a bounce into these key marks or on a move below Friday’s low of $36.32. We will be monitoring XLI closely for a possible short entry.

With Friday’s distribution day, the market appears to have more downside potential. The Nasdaq is now the only one of the five major indices that is still holding support of its 50-day MA. In contrast, the Russell 2000, S&P 500, S&P MidCap 400 and DJIA all face resistance at this key mark. Given the recent distribution in the broad market, at a minimum, it appears that several weeks of sideways action may be needed to repair the recent damage.
stock commentary:
Our market timing model remains on a sell signal. The short-term plan is to wait for market conditions to settle down and new buy patterns to emerge. Patience is an absolute must here, as there isn’t much to do when there are very few (if any) quality buy setups to be found.
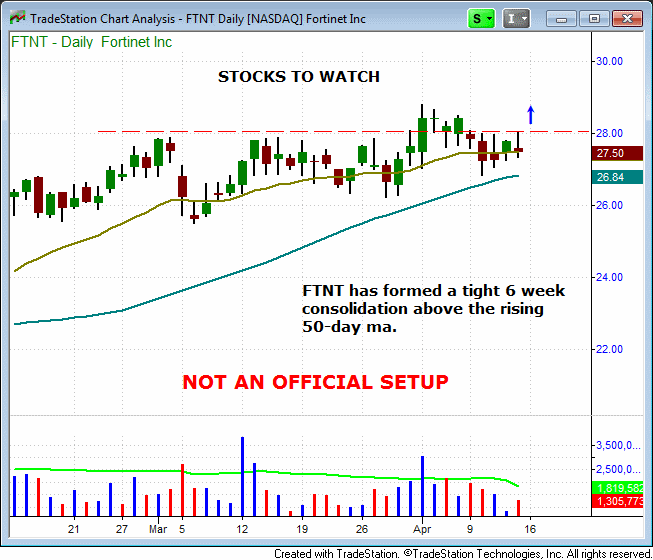
Along with VVUS (from Friday’s report), we are monitoring BIIB, QCOR, LVS, TDG, HOLI, and FTNT. The chart of FTNT details the tight consolidation at the highs (This is not an official setup).

If you are a new subscriber, please e-mail [email protected] with any questions regarding our trading strategy, money management, or how to make the most out of this report.