market timing model:
Sell – Signal generated on the close of October 12 (click here for more details)
today’s watchlist (potential trade entries):
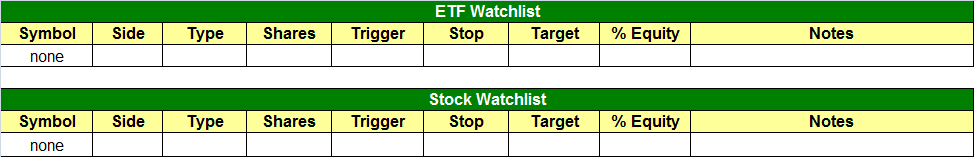
Having trouble seeing the open positions graphic above? Click here to view it directly on your web browser instead.
open positions:
Below is an overview of all open positions, as well as a report on all positions that were closed only since the previous day’s newsletter. Net P/L figures are based on two separate $50,000 model portfolios (one for ETFs and one for stocks). Changes to open positions since the previous report are listed in pink shaded cells below. Be sure to read the Wagner Daily subscriber guide for important, automatic rules on trade entries and exits.
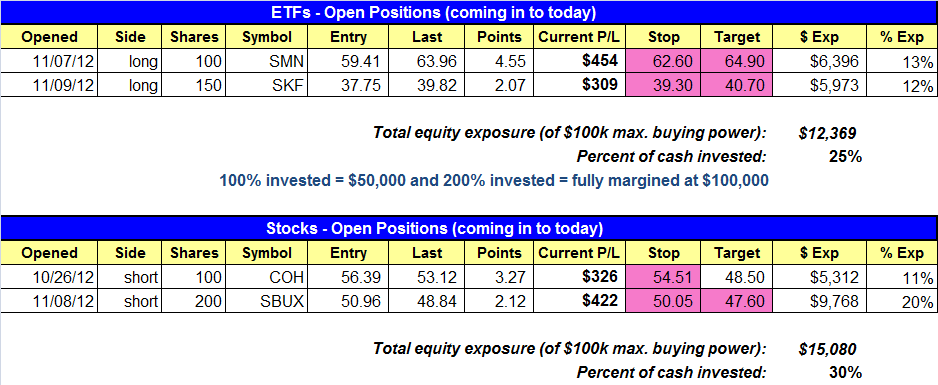
Having trouble seeing the open positions graphic above? Click here to view it directly on your web browser instead.
closed positions:
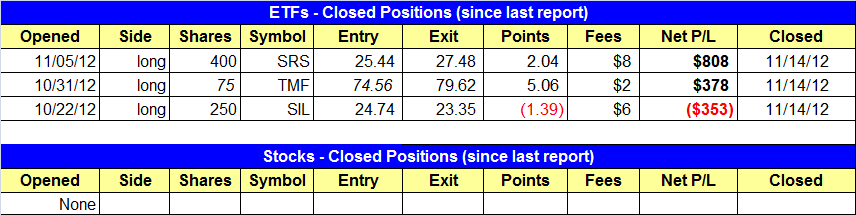
Having trouble seeing the closed positions graphic above? Click here to view it directly on your web browser instead.
ETF position notes:
- Sold SRS and TMF to lock in strong winners. SIL stop triggered for a $350 loss.
stock position notes:
- No trades were made.
ETF and broad market commentary:
After a few minutes of strength on the open, stocks sold off sharply through the morning and once again in the afternoon session, creating a strong trend day to the down side. There was nowhere to hide yesterday, with only 4 of 200 industry groups closing in positive territory, and out of those 4 groups only 1 actually closed higher than the open (the others gapped higher and sold off). All major averages were down at least 1.3% and closed in the bottom 10% of the day’s range. The S&P Midcap 400 and Small-Cap Russell 2000 were the biggest losers on the day, closing 1.9% and 2.0% lower respectively.
Turnover increased by 19% in the NYSE and 17% in the Nasdaq. We have already seen institutions desperate to sell Nasdaq stocks when the Nasdaq cracked the 200-day MA last week. It was the S&P’s turn on Wednesday, with a definitive break of the 200-day MA on increasing volume. There have been a few places one could hide during the recent market selloff but that was not the case yesterday, as groups with relative strength like the homebuilders ($XHB) were hit hard.
After rallying off the summer lows and clearing the 200-day MA in early-September, SPDR S&P Oil & Gas Exploration ($XOP) stalled out after one thrust above the 200-day MA. Over the past few months the price action has deteriorated, starting with the uptrend line break in late October, which coincided with a break of the 50 and 200-day MAs. The 20-day EMA is now below the 50-day MA, and the 50-day MA is beginning to slope lower. We also see a series of lower highs and lower lows the past two months, signaling a reversal of the uptrend. At its current level, $XOP is not actionable on the short side, but it is worth monitoring for an entry on a bounce to the 200-day MA.

Yesterday, on the open, we sold half of $TMF to lock in gains and stopped out of the remaining half position, giving us a profit of $378. Later in the day, as the market broke down $SRS hit its target price of 27.48 and we sold the position for a strong $808 gain. The only disappointment yesterday was the price action in $SIL, which stopped us out beneath the prior day’s low. It looks like our stop was in the right place, as $SIL sold off another 7% below our exit and touched the 200-day MA. This type of selling action is always a good reminder that one should always trade with and honor stops.
As for our open positions in $SKF and $SMN, we have raised the stops once again in order to protect at least half of the unrealized gains as of Wednesday’s close. Do not look at these stops as a magical resistance level that we identified using technical analysis. We basically placed them just below the half way point of yesterday’s wide ranged candles. They are basically “money stops”. If our positions continue to push higher….great, but if the price action reverses we will keep the majority of the profits (barring any gaps).
Typically, for a market to bottom out there needs to be a day or two of panic selling, where investors finally give up on the market and want out at any price. It seems as though Wednesday’s action might be the beginning of such a move, as there isn’t much out there that is holding up. Our short scans have dried up this week, as most sector ETFs have been hit hard and are now too extended to offer low risk entry points. Because of this we will continue to lay low with regard to new positions.
stock commentary:
Yesterday, we lowered the stop in $COH to just above the 20-period moving average. We find the 20-period MA useful as a guide when tightening up our stops on the short side (provided that the price action hasn’t blown up yet and the 20-day EMA isn’t too far away from the current price):

Both stops on open positions are pretty tight, as we are not willing to give back more than half of the open profits. As mentioned in the ETF commentary above, there simply isn’t much out there to short that is low risk and a swing trade. Our unofficial BIDU short setup has acted well the past two days. Those who took the trade may want to think about booking gains at its current level.
If you are a new subscriber, please e-mail [email protected] with any questions regarding our trading strategy, money management, or how to make the most out of this report.
relative strength combo watchlist:
Our Relative Strength Combo Watchlist makes it easy for subscribers to import data into their own scanning software, such as Tradestation, Interactive Brokers, and TC2000. This list is comprised of the strongest stocks (technically and fundamentally) in the market over the past six to 12 months. The scan is updated every Sunday, and this week’s RS Combo Watchlist can be downloaded by logging in to the Members Area of our web site.