market timing model: BUY
Current signal generated on close of November 13.
Portfolio exposure can be anywhere from 50 to 100% long. If positions are holding up well, then one can add exposure beyond 100%.
Past signals:
- Neutral signal generated on close of November 6.
- Buy signal generated on close of September 9
- Neutral signal generated on close of August 15
- Buy signal generated on close of July 11
- Neutral signal generated on close of July 5
- Sell signal generated on close of June 24
today’s watchlist (potential trade entries):

Having trouble seeing the open positions graphic above? Click here to view it directly on your web browser instead.
open positions:
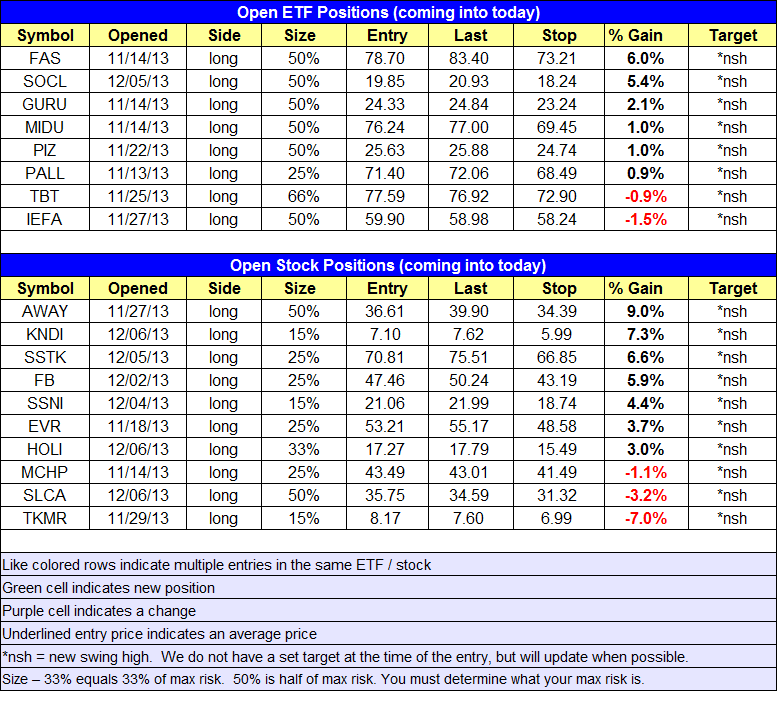
Below is an overview of all open positions, as well as a report on all positions that were closed only since the previous day’s newsletter. Changes to open positions since the previous report are listed in pink shaded cells below. Be sure to read the Wagner Daily subscriber guide for important, automatic rules on trade entries and exits.

Having trouble seeing the open positions graphic above? Click here to view it directly on your web browser instead.
closed positions:

Having trouble seeing the closed positions graphic above? Click here to view it directly on your web browser instead.
ETF position notes:
- No trades were made.
stock position notes:
- No trades were made.
ETF, stock, and broad market commentary:
Stocks sold off across the board, with the Russell 2000 the biggest loser on the day at -0.9%. Aside from the Russell, the losses were contained to -0.3% or less on the remaining averages.
Turnover increased on both the NYSE and NASDAQ. The slightly higher volume on the NYSE produced a valid distribution day in the S&P 500, but the selling was not severe.
One could argue that there was some distribution in the NASDAQ Composite as well, as the reversal off the highs on higher volume is a sign of churning.
Yesterday’s action tells us that the market may continue to chop around for a while, as averages like the Midcap S&P 400 backed away from the swing high.
In yesterday’s report we discussed a potential buy setup in PowerShares Golden Dragon China ($PGJ). We are placing $PGJ on today’s watchlist (trade details can be found above).
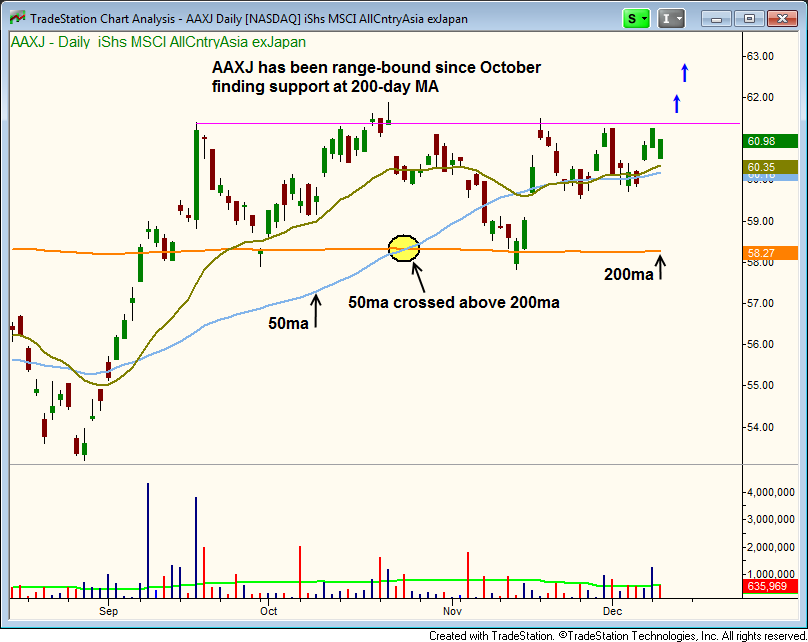
Along with $PGJ, we are also placing iShares MSCI All Country Asia Excluding Japan ($AAXJ) on today’s watchlist.
$AAXJ’s top holding are China 25%, S. Korea 20%, Taiwan 15%, Hong Kong, 13%, and India 8%. In prior reports we discussed the bullish price action in South Korea ($EWY) and Hong Kong ($EWH), so $AAXJ has the majority of its exposure in solid chart patterns.
$AAXJ is setting up for a potential downtrend line breakout on multiple time frames.
On the monthly chart, the price action is now sitting above the downtrend line. If $AAXJ can break the high of November’s bullish reversal candle, then we could potentially see a rally to the prior highs of 2011, which is around $65.

Dropping down to the daily chart, we see the 50-day MA has crossed above the 200-day MA, which is a bullish moving average crossover. The price action has tightened up nicely the past few weeks, holding above the 20 and 50-day MAs. With the 20-day EMA and 50-day MA now pointing in the right direction, it looks as though $AAXJ could be poised for a breakout within the next week or two.

Trade details can be found above.
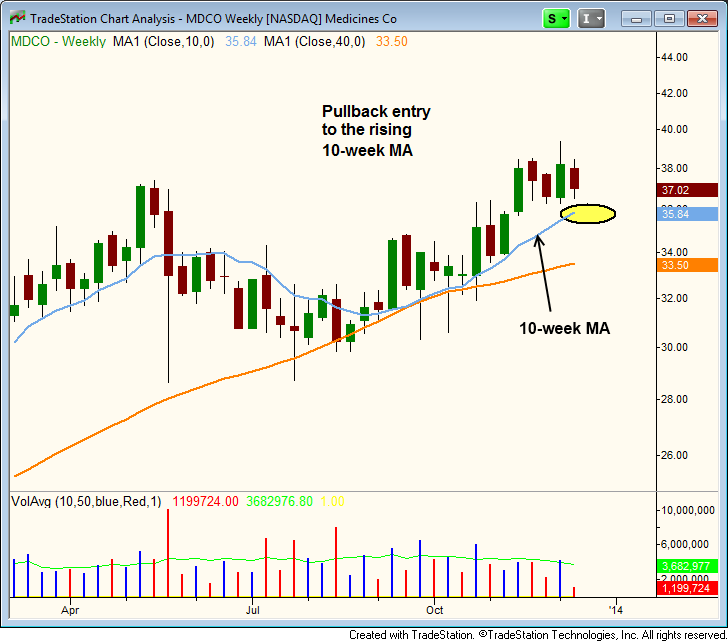
On the stock side, we are placing $MDCO on today’s watchlist as a buy limit order.
$MDCO has formed a bullish base near all-time highs and is attempting to breakout from the base. We are looking for the action to test the 10-week MA either this week or next before moving higher.
The buy entry is on a slight undercut of last week’s low, with a stop below the 50-day MA.
