BUY Signal generated on close of July 7
Bull market rally. Long exposure can be in the 50 – 100% range or more depending on success of open positions.
Note that the market timing model was not created to catch tops and bottoms in the S&P 500. The model was designed to keep our trades in line with the prevailing market trend. Buy signals (confirmed) are generated when the price and volume action of leading stocks and the major averages are in harmony. This means that we could potentially have a buy signal in a major market average, but if leading stocks are not forming bullish patterns, then we are forced to remain on the sidelines until patterns improve.
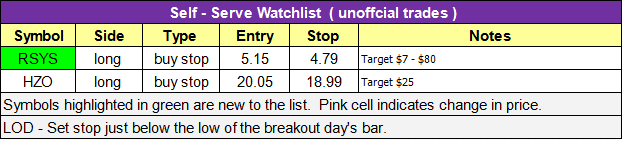
today’s watchlist (potential trade entries):

Having trouble seeing the open positions graphic above? Click here to view it directly on your web browser instead.
open positions:
Below is an overview of all open positions, as well as a report on all positions that were closed only since the previous day’s newsletter. Changes to open positions since the previous report are listed in pink shaded cells below. Be sure to read the Wagner Daily subscriber guide for important, automatic rules on trade entries and exits.

Having trouble seeing the open positions graphic above? Click here to view it directly on your web browser instead.
closed positions:
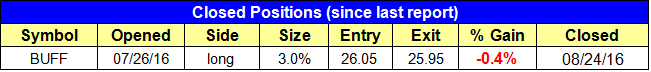
Having trouble seeing the closed positions graphic above? Click here to view it directly on your web browser instead.
position notes:
- Stopped out of $BUFF just below break-even. $MIME buy entry triggered. $RP add triggered.
Broad market indices sold off on a pick up in volume, producing a distribution day for the S&P 500 and Nasdaq Composite.
Most indices remain above the 20-day EMA and last week’s low, but a close below these two support levels would likely lead to further downside.
As long as new buy points in bullish chart patterns emerge, we would view any pullback in the market as a buying opportunity.
The model portfolio added to an existing position in $RP and initiated a new position in $MIME, which closed with a solid gain on volume despite the poor action in the market. $RP, $OLLI, $MIME, $MTCH, and $DLTH held up well. $BABA sold off, but a test of the 20-day MA could present us with a low risk entry point.
$LN had a rough session, gapping lower and selling off 6% on a pick up in volume. We are placing a hard stop 11 cents beneath the days low just in case it gaps up and holds the prior day’s low and bounces higher. This is a hard stop.
$LMAT reversed 3% off the highs, but did so on slightly lighter volume. If the price action can hold the $16.90 area on a closing basis, then it may have a shot of reversing higher.
For those not already long, a move above $17.55 is a buy signal.

The $OLLI buy setup remains on the watchlist but there are no new setups for today. Depending on how the market reacts tomorrow, there may be a few buy setups on Friday or next Monday.
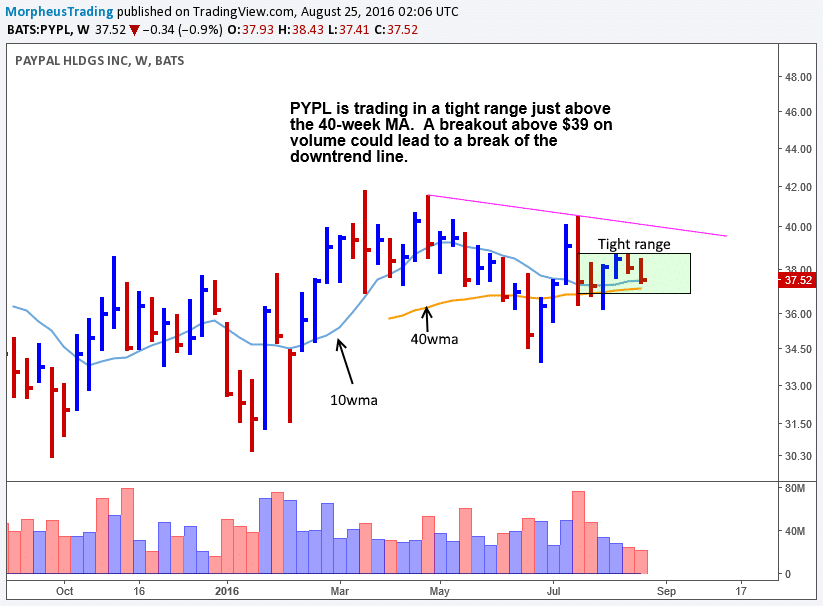
We are monitoring $PYPL once again, as it has held the 40-week MA the past few weeks after gapping lower on earnings. There is no entry right now, but a big reversal candle off the lows could prompt us to take a small position with the idea of building size as it moves higher.
This is an unofficial watchlist of potential setups for today’s session (trade results will not be monitored). This list is for experienced traders only who are looking for a few ideas. No targets will be listed. Please check for earnings before entering.
All stops are on a closing basis unless listed as a “hard” stop.