market timing model: BUY Signal generated on close of July 7
Building long exposure with a new rally potentially underway. Exposure can be in the 50 – 100% range or more, if one has held on to positions through the market pullback.
Note that the market timing model was not created to catch tops and bottoms in the S&P 500. The model was designed to keep our trades in line with the prevailing market trend. Buy signals (confirmed) are generated when the price and volume action of leading stocks and the major averages are in harmony. This means that we could potentially have a buy signal in a major market average, but if leading stocks are not forming bullish patterns, then we are forced to remain on the sidelines until patterns improve.
today’s watchlist (potential trade entries):

Having trouble seeing the open positions graphic above? Click here to view it directly on your web browser instead.
open positions:
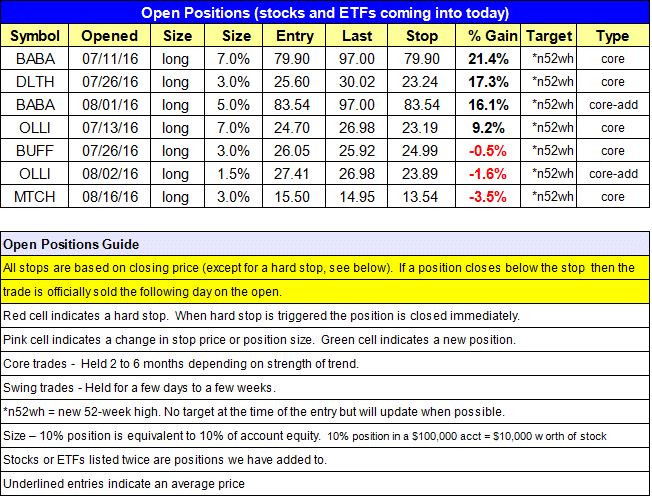
Below is an overview of all open positions, as well as a report on all positions that were closed only since the previous day’s newsletter. Changes to open positions since the previous report are listed in pink shaded cells below. Be sure to read the Wagner Daily subscriber guide for important, automatic rules on trade entries and exits.

Having trouble seeing the open positions graphic above? Click here to view it directly on your web browser instead.
closed positions:

Having trouble seeing the closed positions graphic above? Click here to view it directly on your web browser instead.
position notes:
- Sold $CDK on the open for a small loss.
Broad market averages sold off early, but managed to bounce higher in the afternoon and close near the highs of the day, forming bullish reversal candles on the daily charts. The S&P 500, Nasdaq Composite, and Nasdaq 100 closed in positive territory and back above the rising 10-day MA.
Ideal price action following a bullish reversal candle is a morning gap up with follow through to the upside. Let’s see if buyers are willing to step in on strength following a two-day pullback.
We sold $CDK on Wednesday’s open for a small -1.5% loss or -$60 loss in the 50k model portfolio. We will continue to monitor the action for a potential pullback entry off the 50-day MA.
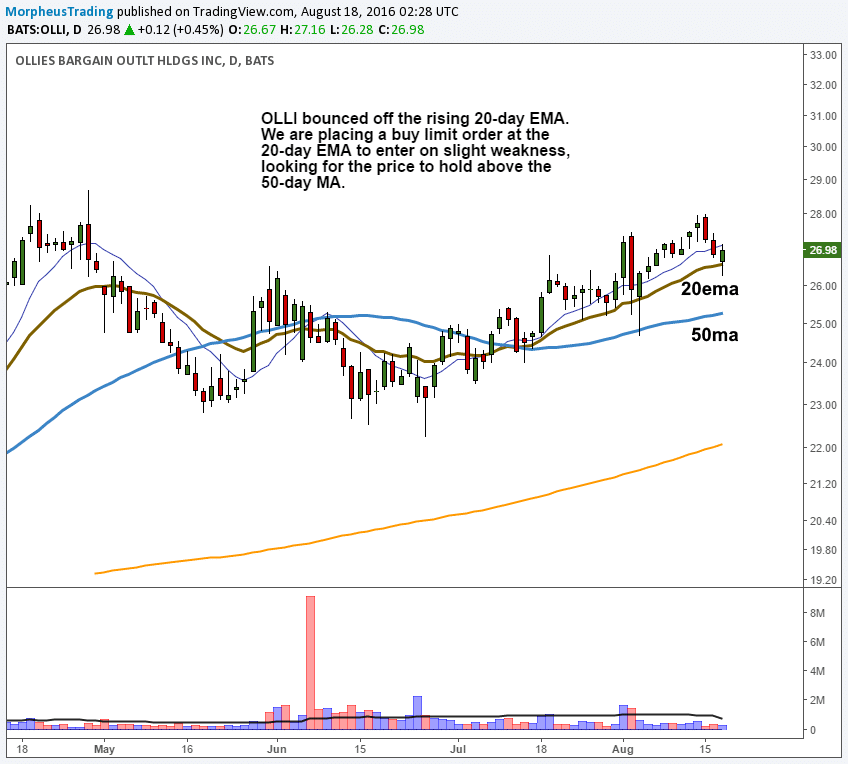
We have one new official buy setup on today’s watchlist in $OLLI, which is a limit order at the 20-day EMA.
The add is only for a 1.5% position to bring $OLLI back to 10% (we stopped out of 1.5% on 8/3). The stop is below the 50-day MA to give a little wiggle room, but we’d prefer the action hold above $26.

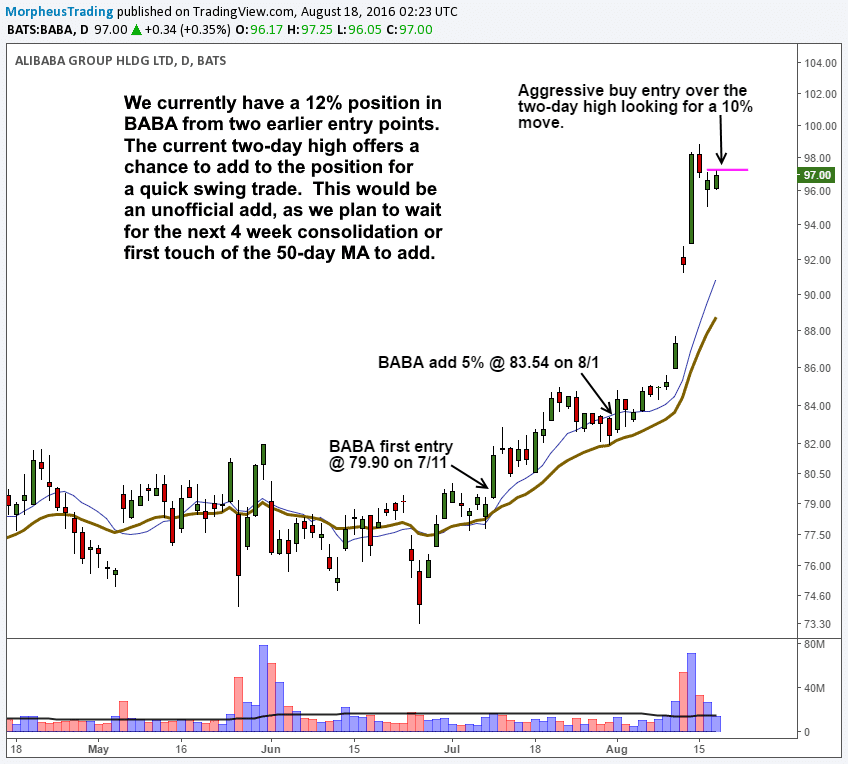
$BABA has tightened up the past two days and is buyable over the two-day high for a swing trade. The target is roughly a 10% move with a 3% stop.
This is an unofficial setup, as we plan on sitting tight with our 12% position and waiting for a longer consolidation or pullback to the 50-day MA to add. That being said, it is still a solid trade over the two-day high with a stop beneath the two-day low on a closing basis.

This is an unofficial watchlist of potential setups for today’s session (trade results will not be monitored). This list is for experienced traders only who are looking for a few ideas. No targets will be listed. Please check for earnings before entering.
All stops are on a closing basis unless listed as a “hard” stop.
