market timing model:
Sell – Signal generated on the close of October 12 (click here for more details)
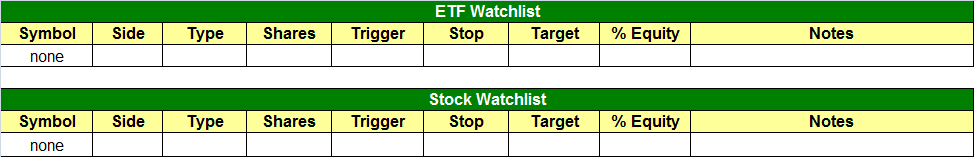
today’s watchlist (potential trade entries):
Having trouble seeing the open positions graphic above? Click here to view it directly on your web browser instead.
open positions:
Below is an overview of all open positions, as well as a report on all positions that were closed only since the previous day’s newsletter. Net P/L figures are based on two separate $50,000 model portfolios (one for ETFs and one for stocks). Changes to open positions since the previous report are listed in pink shaded cells below. Be sure to read the Wagner Daily subscriber guide for important, automatic rules on trade entries and exits.
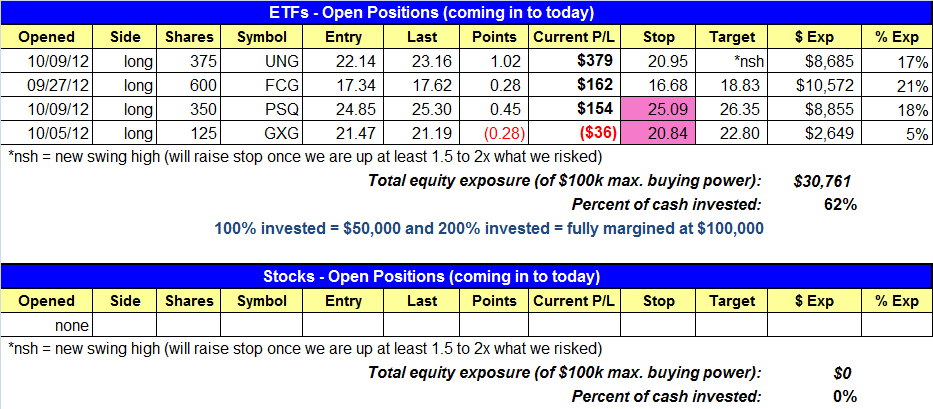
Having trouble seeing the open positions graphic above? Click here to view it directly on your web browser instead.
closed positions:
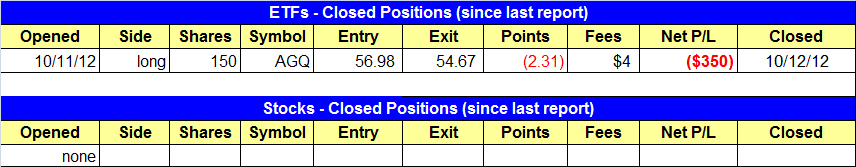
Having trouble seeing the closed positions graphic above? Click here to view it directly on your web browser instead.
ETF position notes:
- AGQ long position stopped out.
stock position notes:
- No trades were made.
ETF and broad market commentary:
After getting off to a relatively flat start, stocks attempted to move higher on the open, but the bears once again took control and erased the intraday rally attempt. The major indices drifted lower after the first 90 minutes of trading, then oscillated in a sideways range throughout the rest of the day. The Dow Jones Industrial Average ($DJIA) finished unchanged, as the S&P 500 Index ($SPX) fell 0.3%. The Nasdaq Composite ($COMPX) slipped just 0.2%, but it was the sixth consecutive day of losses in the tech-heavy index. The small-cap Russell 2000 Index ($RUT) and S&P Midcap 400 Index ($MID) shed 0.8% and 0.7% respectively.
Turnover eased across the board, indicating that banks, mutual funds, hedge funds, and other institutions were not active participants in last Friday’s selling pressure. Total volume in the NYSE was 11% lighter than the previous day’s level, while volume in the Nasdaq receded 3%. In both exchanges, trade was lighter than 50-day average levels. In the NYSE, declining volume exceeded advancing volume by a ratio of approximately 3 to 1. However, the Nasdaq ADV/DEC volume ratio was negative by less than 3 to 2. Although the main stock market indexes closed mostly lower for the day, the market internals were not that bad.
Given that the Nasdaq 100 Index has been drifting lower for the past six days (including last Friday’s flat closing price), it’s becoming a bit “oversold” in the near-term. We hesitate to use the term “oversold” because it’s a relative term and stocks and ETFs can frequently become much more “oversold” before eventually bouncing. Therefore, we use the term loosely. Nevertheless, odds now favor at least a short-term bounce off the lows in the coming week. As such, we have tightened our protective stop on ProShares Short QQQ ($PSQ) to just below last Friday’s (October 12) intraday low. This new stop price will still enable us to capture further gains if the Nasdaq 100 fails to bounce today and continues extending its losing streak. However, we will still quickly lock in a gain on the position if the Nasdaq suddenly bounces sharply higher or a “short squeeze” sets in.
Ideally, we would actually like to see a substantial bounce in the Nasdaq 100 Index up to new resistance of its 50-day moving average (remember that a prior level of support becomes the new level of resistance after the support is broken). If the Nasdaq bounces into the 50-day moving average and stalls, we would then have a low-risk re-entry point for selling short the Nasdaq 100 Index, with a much more positive reward-risk ratio, in anticipation of the index making another leg down. The ideal bounce for the Nasdaq 100 is annotated below on the daily chart of PowerShares QQQ trust ($QQQ), a very popular ETF proxy for the Nasdaq 100 Index:

On October 9, ProShares Ultra Silver Trust ($AGQ), a leveraged commodity ETF that tracks the price of spot silver, “undercut” near-term support of its 20-day exponential moving average, but closed with a bullish reversal candle. The following day, the ETF traded in a tight, sideways range near the previous day’s high. This created a low-risk pullback setup for potential buy entry above the two-day high of October 9 and 10. As such, we bought AGQ on October 11, when it hit our trigger price for buy entry by moving above the two-day high. However, price action was immediately disappointing on the day of entry, as the ETF failed to hold above the trigger price and closed at its intraday low. The following day, October 12, AGQ gapped down below its 20-day EMA, trended lower intraday, then finished below the low of the bullish reversal bar from October 9. This caused our protective stop to be hit, as we did not want to see AGQ come back down below the October 9 low after triggering for buy entry. This is shown on the daily chart of AGQ below:

While it was disappointing that AGQ did not follow-through as anticipated, it was no big deal. First of all, our ETFs have already been doing very well over the past two months. More importantly, losing trades are simply a part of the business that must be truly accepted and expected before one can ever expect to become a professional trader. There is a lot of educational value to analyzing losing trades, sometimes even more so than analyzing what we did right in winning trades (although many other stock picking services and newsletters conveniently tend to ignore their losing trades, while hyping the big winners). In this case, our protective stop in AGQ was technically in the right place, and we simply followed the plan by exiting the trade with a smaller than average loss when the stop was hit. Nevertheless, we will continue monitoring the price action of spot silver because we still like the pattern and our entry may have just been a bit too early. Now, we will look for another reversal candle to form on high volume, but would probably not enter the trade until it gets back above the high of October 11.
stock commentary:
Our timing model originally shifted from confirmed buy to neutral on the close of Oct. 5, which was listed in the Oct. 8 report. We immediately tightened up our stops to lock in gains and limit losses, and by the close of Oct. 9 we were sitting in a 100% cash position (in the stock portfolio). We are shifting the model back to sell mode tonight due to last week’s heavy volume breakdown below the 50-day MA on the Nasdaq Composite. With the shift to sell mode, we have to be a bit more patient with the market and new setups rather than jumping right back in. The short-term plan is to wait for market conditions to settle down (stop making new swing lows) along with some sort of accumulation day. We are in no rush to put trades on for the sake of trading. For those who feel the need to always be active with your trading, I challenge you to identify these periods in your stats and see if these trades were at all profitable. For all those who are new to trading, there is nothing more powerful to the learning process than keeping stats of all trades. Sometimes there is a very big difference in what we think happened and what really happened in terms of P&L.
There are no new setups for today. Potential longs we are monitoring along with stocks we mentioned last Friday are: CTRX KORS LULU VRX LOPE NTE ALXN VSI SMBL RDEN. We may take on some short exposure If the market bounces higher on weak volume and strong stocks are unable to bounce or continue to break down.
If you are a new subscriber, please e-mail [email protected] with any questions regarding our trading strategy, money management, or how to make the most out of this report.
relative strength combo watchlist:
Our Relative Strength Combo Watchlist makes it easy for subscribers to import data into their own scanning software, such as Tradestation, Interactive Brokers, and TC2000. This list is comprised of the strongest stocks (technically and fundamentally) in the market over the past six to 12 months. The scan is updated every Sunday, and this week’s RS Combo Watchlist can be downloaded by logging in to the Members Area of our web site.