Current signal generated on close of September 9.
Portfolio long exposure can be anywhere from 50% to 100% or more if you have positions that help up while the market sold off.
Past signals:
- Neutral signal generated on close of August 15
- Buy signal generated on close of July 11
- Neutral signal generated on close of July 5
- Sell signal generated on close of June 24
today’s watchlist (potential trade entries):

Having trouble seeing the open positions graphic above? Click here to view it directly on your web browser instead.
open positions:
Below is an overview of all open positions, as well as a report on all positions that were closed only since the previous day’s newsletter. Changes to open positions since the previous report are listed in pink shaded cells below. Be sure to read the Wagner Daily subscriber guide for important, automatic rules on trade entries and exits. Click here to learn the best way to calculate your share size.

Having trouble seeing the open positions graphic above? Click here to view it directly on your web browser instead.
closed positions:
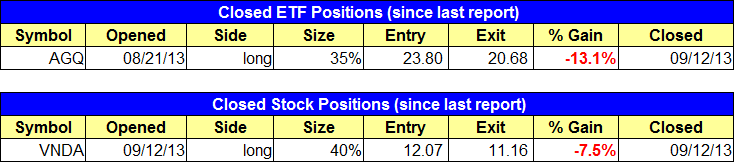
Having trouble seeing the closed positions graphic above? Click here to view it directly on your web browser instead.
ETF position notes:
- $AGQ sell stop triggered and we are out. Please note that $EGPT is now a buy limit order.
stock position notes:
- $VNDA sell stop triggered.
ETF, stock, and broad market commentary:
Stocks sold off into the close, finishing near the lows of the session and in negative territory across the board. The losses were limited to the -0.2% to 0.3% range, except on the Russell 2000, which dropped 0.7%. Volume eased on both exchanges, preventing the S&P 500 and NASDAQ from registering a bearish distribution day.
Our long position in First Trust ISE Revere Natural Gas ($FCG) continues to act well, as it has rallied 3% this week on a big pick up in volume. $FCG may run into a bit of resistance around $18.70, but the current breakout from a six month long base should generate enough momentum to push the price action to the next big resistance level on the monthly chart around $20.
We stopped out of our leveraged silver ETF position in $AGQ, as the price action broke down below the 20-day EMA. We were looking for $SLV to hold up around the 20-day EMA for another week or two before attempting to push higher, but Thursday’s breakdown nullified the setup, as the odds now favor $SLV testing the 50-day MA before going higher. Our $EGPT setup did not officially trigger yesterday, due to the 5-minute rule. The plan now is to buy $EGPT on a pullback to the 20-ema on the hourly chart.
We continue to monitor iShares Dow Jones US Real Estate ($IYR) for a low risk short entry around the 50-day MA, which could possibly develop in the next few weeks. The 61.8% Fibo level at $66 should also provide resistance. We are in no rush to short right now, but it never hurts to have a list of shorts ready to go.

After a false breakout to new highs on the weekly chart in April, United States Natural Gas Fund ($UNG) sold off for 15-weeks before putting in a false breakdown below the prior lows in July. The false breakout action on either side of the market has frustrated many traders, so the next breakout could be the one that works. Currently, $UNG is sitting on top of its 10-week MA (that is beginning to flatten out) after breaking the downtrend line. However, $UNG still has a ton of work to do to technically, as the 10-week MA has yet to trend higher and is still well below the 40-week MA.

On the stock side, we stopped out of $VNDA right before it formed a bullish reveral candle on the daily chart. We will look to re-enter the position on a move above yesterday’s high with reduced size because the setup is still very much in play.
We are monitoring potential long setups in $AMBA and $SCTY, which remains on the buy watchlist for today. We are also looking for an entry on a pullback in $POWI.
The volume on the breakout was pretty light, so a pullback to the 20-day EMA within the next few days could present us with an ideal, low risk entry point, especially if there is some sort of shakeout bar in increased volatility at or below the 20-day EMA.
