Buy– Signal generated on the close of December 31 (click here for more details)
today’s watchlist (potential trade entries):

Having trouble seeing the open positions graphic above? Click here to view it directly on your web browser instead.
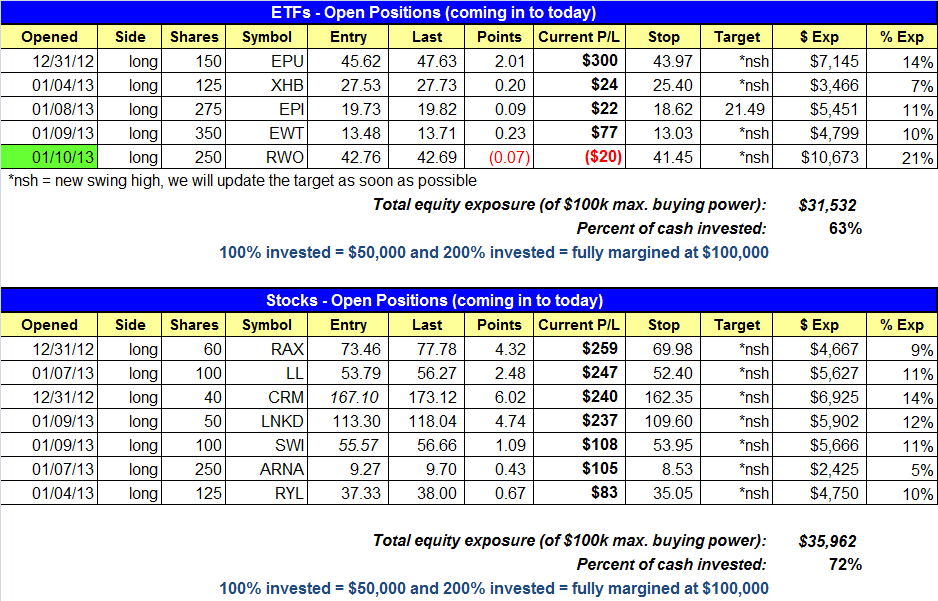
open positions:
Below is an overview of all open positions, as well as a report on all positions that were closed only since the previous day’s newsletter. Net P/L figures are based on two separate $50,000 model portfolios (one for ETFs and one for stocks). Changes to open positions since the previous report are listed in pink shaded cells below. Be sure to read the Wagner Daily subscriber guide for important, automatic rules on trade entries and exits.
Having trouble seeing the open positions graphic above? Click here to view it directly on your web browser instead.
closed positions:

Having trouble seeing the closed positions graphic above? Click here to view it directly on your web browser instead.
ETF position notes:
- $RWO trade triggered.
stock position notes:
- No trades were made.
ETF, stock, and broad market commentary:
A sign of a strong bull market is when the major averages are able to fight off early weakness, push higher in the afternoon, and close near the highs of the day. Such was the action in the market on Thursday, as stocks sold off early but were able to rebound in the afternoon. The strong reversal action led to a new 52-week closing high in the S&P 500.
Total volume increased by 9% on the NYSE, allowing the S&P 500 to register a bullish accumulation day. Volume was up by less than 1.0% on the Nasdaq. The major averages have fought off distribution on two occasions this week, which is a bullish sign. The averages could have easily rolled over and closed at the lows of the day, but we continue to see buying interest on dips. Leading stocks are acting well and recent breakouts are working. These are clear signs that the market is getting stronger.
We added one new position to the ETF portfolio yesterday in $RWO. As mentioned in Wednesday’s report, $EPI triggered a buy entry over the two-day high for those who missed our initial entry point.
The iShares MSCI Taiwan Index ($EWT) triggered a buy entry in the ETF portfolio on Jan. 9, over the high of Jan. 8. It looks as though $EWT is forming a pennant, setting a series of lower highs and higher lows within a tight range.

Ideally, we’d like to see some sort of short pause, with two or three day of sideways action above 13.50 to generate a low risk buy entry. A short pause would allow us to add to our position in anticipation of the ETF breaking out sometime next week.
Although not an actionable setup, the daily chart of the iShares Barclays 20+ Yr Treasury Bond ($TLT) is confirming the strength in equities. The breakdown in the bond market shows inventors moving out of safety (bonds) and taking on risk (stocks). We also see that the 50-day MA is about to cross below the 200-day MA. This bearish moving average crossover is known as the “death cross” because is signals a major (negative) shift in the trend.

On the stock side, $LNKD broke out on heavy volume and closed above the 117.32 breakout pivot. Also of note, $SWI recovered nicely off the lows of the day.
We do have one new setup on today’s watchlist in $POL. After breaking out on heavier than average volume last week, $POL has pulled back in orderly fashion and on lighter volume, which is a bullish sign. Thursday’s candle, which stopped just shy of the 10-day MA provides us with a low risk entry point over the day’s high. The stop is placed just beneath the day’s low. $POL has a 96 relative strength ranking and is a leader within its group (Chemicals-Plastics). The group ranking is currently 6 out of 197, so the group as a whole has great momentum.

If you are a new subscriber, please e-mail [email protected] with any questions regarding our trading strategy, money management, or how to make the most out of this report.
relative strength combo watchlist:
Our Relative Strength Combo Watchlist makes it easy for subscribers to import data into their own scanning software, such as Tradestation, Interactive Brokers, and TC2000. This list is comprised of the strongest stocks (technically and fundamentally) in the market over the past six to 12 months. The scan is updated every Sunday, and this week’s RS Combo Watchlist can be downloaded by logging in to the Members Area of our web site.