market timing model: BUY
Current signal generated on close of November 13.
Portfolio exposure can be anywhere from 50 to 100% long. If positions are holding up well, then one can add exposure beyond 100%.
Past signals:
- Neutral signal generated on close of November 6.
- Buy signal generated on close of September 9
- Neutral signal generated on close of August 15
- Buy signal generated on close of July 11
- Neutral signal generated on close of July 5
- Sell signal generated on close of June 24
today’s watchlist (potential trade entries):

Having trouble seeing the open positions graphic above? Click here to view it directly on your web browser instead.
open positions:
Below is an overview of all open positions, as well as a report on all positions that were closed only since the previous day’s newsletter. Changes to open positions since the previous report are listed in pink shaded cells below. Be sure to read the Wagner Daily subscriber guide for important, automatic rules on trade entries and exits.

Having trouble seeing the open positions graphic above? Click here to view it directly on your web browser instead.
closed positions:

Having trouble seeing the closed positions graphic above? Click here to view it directly on your web browser instead.
ETF position notes:
- No trades were made.
stock position notes:
- No trades were made.
ETF, stock, and broad market commentary:
Stocks kicked off the week with a strong open that saw all major averages up at least 1.0% by 10 am. The morning bounce was the first sign of life in the market since last Wednesday’s distribution day. However, the initial surge lacked any follow through, as most stocks basically pulled back in or chopped around the rest of the session.
The small cap Russell 2000 was the only index to push to new intraday highs in the afternoon, as it outperformed with a gain of 1.2%.
Turnover increased on both exchanges. The NASDAQ Composite and S&P 500 also closed well off the highs of the session, and in the bottom half of the day’s range. The combination of higher volume and stalling action is known as churning, which is bearish (like a distribution day).
The stalling action could point to a slight pullback over the next few days. Given last week’s heavy selling and Monday’s churning, it is probably best to lay low through the end of the year. For those establishing new long positions, do so with reduced size and make sure not to overtrade.
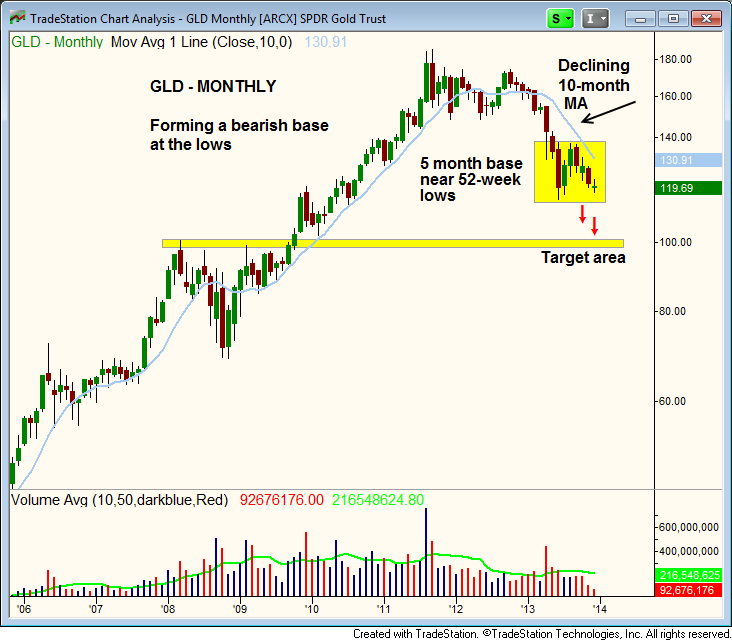
Since breaking through an important support level at $150, SPDR Gold Trust ($GLD) has been in distribution mode. Over the past five months, $GLD has formed a bearish base just below the declining 10-month MA, which is like the 200-day moving average on the daily chart.
The current base should eventually break down to new 52-week lows, and potentially find support somewhere around $100, which is the high of a significant base from 2008 and 2009.
Rather than shorting $GLD itself, we prefer to short gold by going long the Gold Double Short ETN ($DZZ).
$DZZ sold off to and undercut the 20-day EMA early in the morning, but immediately reversed and rallied back above the mid-point of the day’s range by the close. The reversal was bullish, but the price action still must climb above yesterday’s high to follow through.
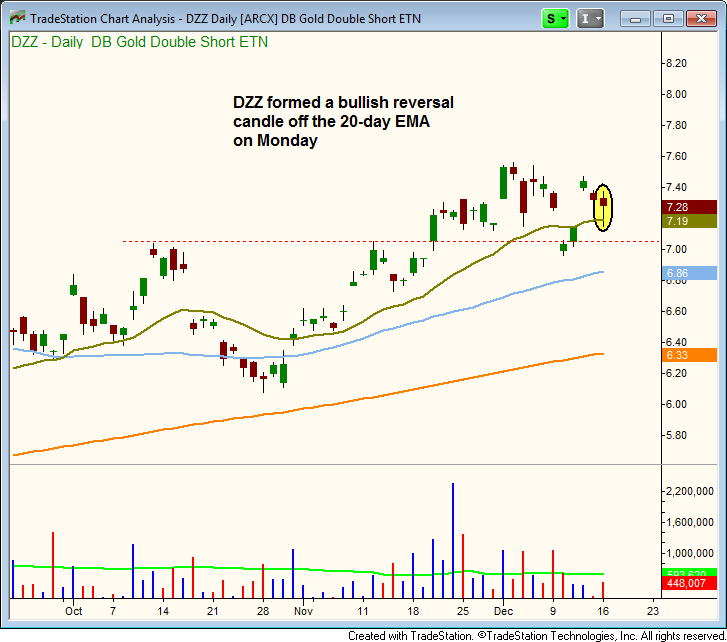
We are placing $DZZ on the official watchlist. Trade details can be found above.
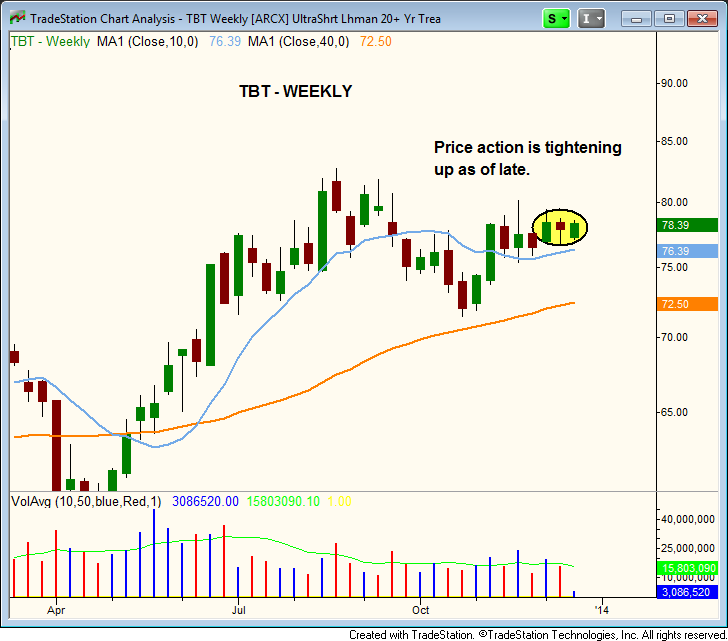
Our short position in the ProShares UltraShort Lehman 20+ Yr ($TBT) continues to act well. $TBT has tightened up the past few weeks while holding the 10-week MA. The 10-week MA has begun to trend higher as well, which is a good sign.
$TBT if forming its first significant base after a strong trend reversal, so this consolidation should eventually produce a powerful breakout.
On the stock side, we plan to lay low for the most part, unless we are able to find some good bargains in leading stocks on a pullback.
$SLCA formed a bullish reversal candle, but still needs to follow through to the upside. We are lowering the stop by 1 point to allow for some wiggle room.
$SSTK and $EVR broke out to new highs on strong volume yesterday. $SSNI and $TKMR recovered off the lows and may be ready to reverse higher with a bit more work.
The $WDAY buy setup remains in good shape and a breakout above the hourly downtrend line could spark the next wave up.
The $SYNA buy setup is also in good shape, as it continues to trade in a tight range.