Sell Mode
– Timing model generated sell signal on close of February 25 (click here for more details)
today’s watchlist (potential trade entries):

Having trouble seeing the open positions graphic above? Click here to view it directly on your web browser instead.
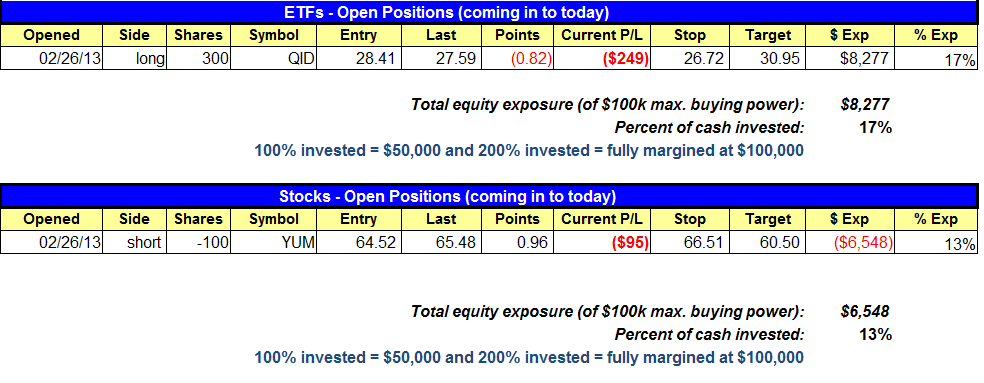
open positions:
Below is an overview of all open positions, as well as a report on all positions that were closed only since the previous day’s newsletter. Net P/L figures are based on two separate $50,000 model portfolios (one for ETFs and one for stocks). Changes to open positions since the previous report are listed in pink shaded cells below. Be sure to read the Wagner Daily subscriber guide for important, automatic rules on trade entries and exits.
Having trouble seeing the open positions graphic above? Click here to view it directly on your web browser instead.
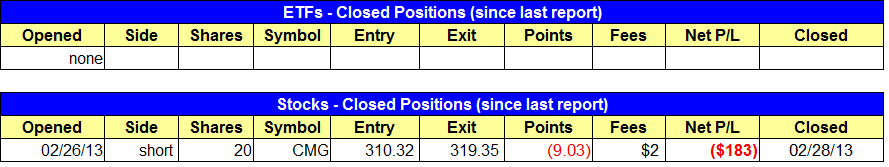
closed positions:
Having trouble seeing the closed positions graphic above? Click here to view it directly on your web browser instead.
ETF position notes:
- No trades were made.
stock position notes:
- $LULU short setup added to the watchlist. We have reduced the size down to about a $150 loss due to recent losses in $CMG and $DKS.
- $CMG buy stop triggered and we coverd our short position for a $180 loss.
ETF, stock, and broad market commentary:
After a sharp, three day bounce off the swing lows on light volume, stocks retreated into the close on Thursday, with all major averages dropping -0.6% to -0.9% in the final hour of trading on higher volume. The increase in turnover, combined with the stalling action in the averages produced a bearish day of churning on the Nasdaq and S&P 500. As we have been saying the past few days, although the market has pushed higher, the volume patterns have remained bearish. Thursday’s price and volume action reinforced the sell signal generated by our timing model on February 26. Volume plays a crucial role in identifying market tops and bottoms. Many investors make the mistake of focusing on price patterns or percent gains of an index and pay little or no attention to total volume.
Since 2006, we have been running our market timing model internally and it has always done a pretty good job of keeping us in line the intermediate-term trend, which is where we operate with our short to intermediate-term swing trading system. As mentioned above, our timing model flashed a sell signal on February 26. The market does not always have to break down immediately for the timing model to have value. As we have seen in the past, sometimes a signal is generated and the market rolls over immediately, while other signals have led to a short-term bounce in the market before breaking down. We can never know in advance what will happen after a sell signal, but we always respect the signal by going to cash and/or tightening up stops and waiting for conditions to improve before establishing new long positions.
Here are the last two sell signals generated by the timing model in 2012:
After a decent rally in early 2012, the distribution days began to pile up in late April and early March, forcing us out of several positions by March 3 and generating a 100% sell signal on the close of May 4. In this case, the signal was perfect as the market tanked 7% in 10 sessions.

After a very short August/September rally, the distribution days piled up once again over a short period of time which led to a sell signal on the close of October 12. The market did not fall apart immediately, and there was a short lived bounce that may have attracted some “late to the party” buyers not paying attention to volume. After one day of stalling on October 18, the market sold off sharply, erasing all gains in August and September.

Finally, our most recent sell signal on February 26. Much like the last sell, the market did not sell off right away and has bounced for a few days. Who knows if the market will sell off sharply over the next few weeks. That being said, we are not willing to establish new long positions the past few days because we know what can happen when the market volume patterns turn bearish.

If you are just now subscribing to our newsletter or have been on board for a week or two, you are seeing how we operate during a potential trend reversal, which is pretty different than a few weeks ago, when we were loaded up on the long side and trading on margin. Whenever the market is attempting to reverse there is usually a big jump in price volatility. When volatility increases, trading can become quite emotional, leading to bad decisions and a ton of regret. The best way to remove (as best we can) the emotions of trading is to follow a well defined trading system. Our market timing model allows us to operate with confidence during stressful periods in the market. Are we wrong sometimes…of course! But successful trading isn’t about being right or wrong, it’s about doing the right thing. When we do the right thing the money eventually follows.
If you are a new subscriber, please e-mail [email protected] with any questions regarding our trading strategy, money management, or how to make the most out of this report.
relative strength combo watchlist:
Our Relative Strength Combo Watchlist makes it easy for subscribers to import data into their own scanning software, such as Tradestation, Interactive Brokers, and TC2000. This list is comprised of the strongest stocks (technically and fundamentally) in the market over the past six to 12 months. The scan is updated every Sunday, and this week’s RS Combo Watchlist can be downloaded by logging in to the Members Area of our web site.