Buy
– Signal generated on the close of April 30 (click here for more details)
today’s watchlist (potential trade entries):

Having trouble seeing the open positions graphic above? Click here to view it directly on your web browser instead.
open positions:
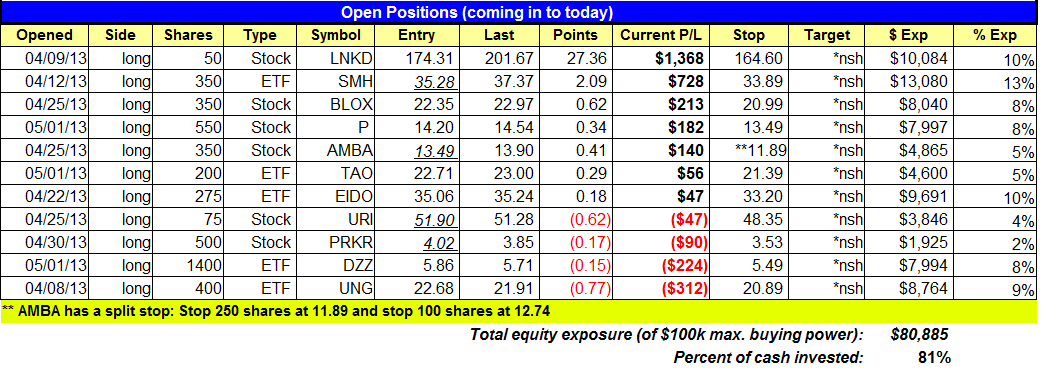
Below is an overview of all open positions, as well as a report on all positions that were closed only since the previous day’s newsletter. Net P/L figures are based a $100,000 model portfolio. Changes to open positions since the previous report are listed in pink shaded cells below. Be sure to read the Wagner Daily subscriber guide for important, automatic rules on trade entries and exits.

Having trouble seeing the open positions graphic above? Click here to view it directly on your web browser instead.
closed positions:

Having trouble seeing the closed positions graphic above? Click here to view it directly on your web browser instead.
ETF position notes:
- No trades were made.
stock position notes:
- No trades were made.
ETF, stock, and broad market commentary:
The current market rally continues to build steam, led by the relative strength in the Nasdaq Composite, as it pulls away from the 3,300 breakout level. The Nasdaq rallied 1.3% on Thursday, and is the only index to have broken out to new swing highs. The S&P 500 rallied 0.9%, and the Russell 2000 closed back above the 50-day MA with a solid 1.7% advance. Volume was light on both exchanges, which prevented the averages from logging an official accumulation day, but we saw plenty of solid buying in leading stocks.
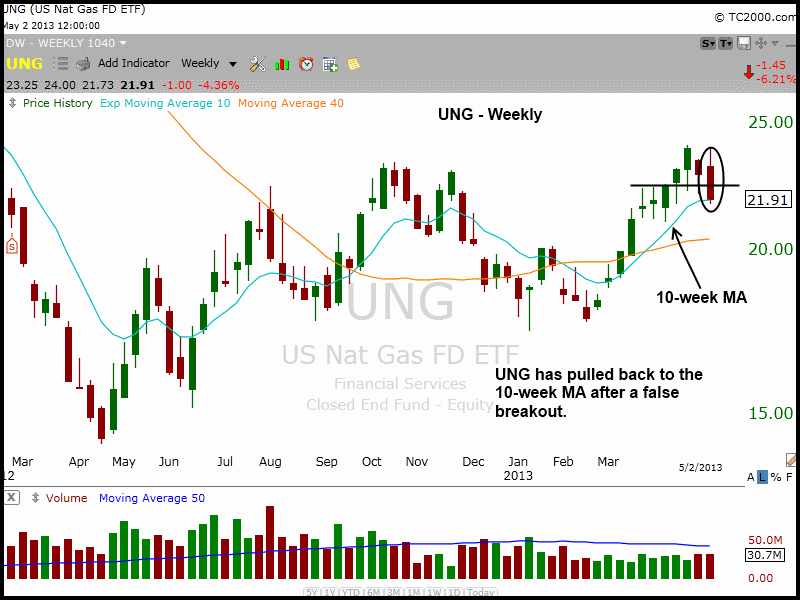
Natural Gas ETF ($UNG) was hit hard on Thursday, dropping 6% on heavy volume. With the price action breaking the bullish reversal candle low of 4/26 and the 20-day EMA, $UNG may need a few more weeks of consolidation before it can head higher. There is support from the 10-week moving average on the weekly chart below. The 50-day MA on a daily chart is slightly lower at 21.42.

We entered the trade based on the weekly chart, and although we monitor price action all day, it sometimes pays to take a step back and focus on the bigger picture. $UNG’s chart remains intact, but we certainly would like to see the price action hold above $21 and set a higher swing low on the weekly chart. The 10-week crossed above the 40-week MA a few weeks ago, which is bullish trend reversal signal. We must be patient here and let the new uptrend develop.
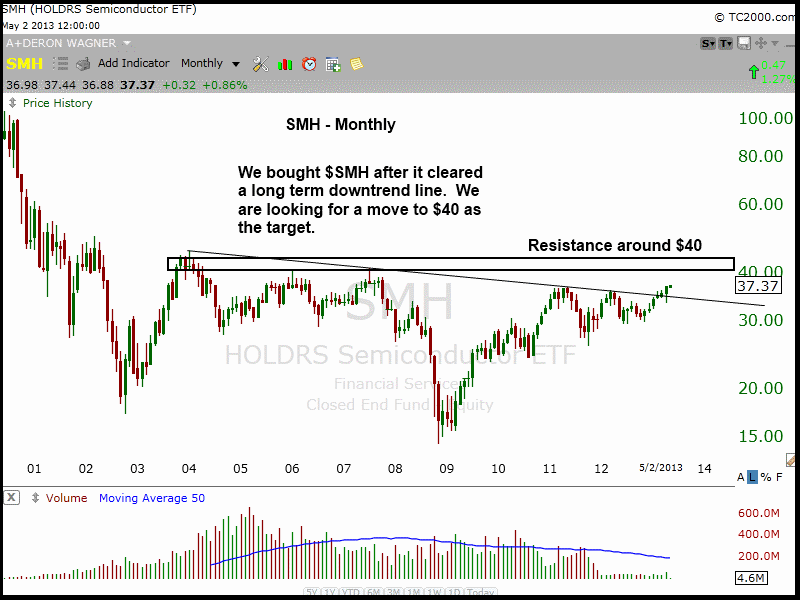
$SMH continues to act well, but is a bit extended from the 20-day EMA and could be due for a short-term pullback. We bought $SMH based on a long-term downtrend line breakout, so we are not looking to take profits on the first move after the breakout.

Although $SMH is extended in the short-term, we must follow the trade plan and let the trade play out. The unofficial target for $SMH is around the $40 level, which is where we see a zone of resistance on the monthly chart above. As the saying goes, “plan the trade and trade the plan”, which is much easier said than done. We all make mistakes, but those who consistently stick with the original game plan avoid acting on emotion, and that is usually when bad decisions are made.
$FDN rallied 1.6% higher yesterday. For those who took the unofficial trade setup please continue to hold with no change in stop.
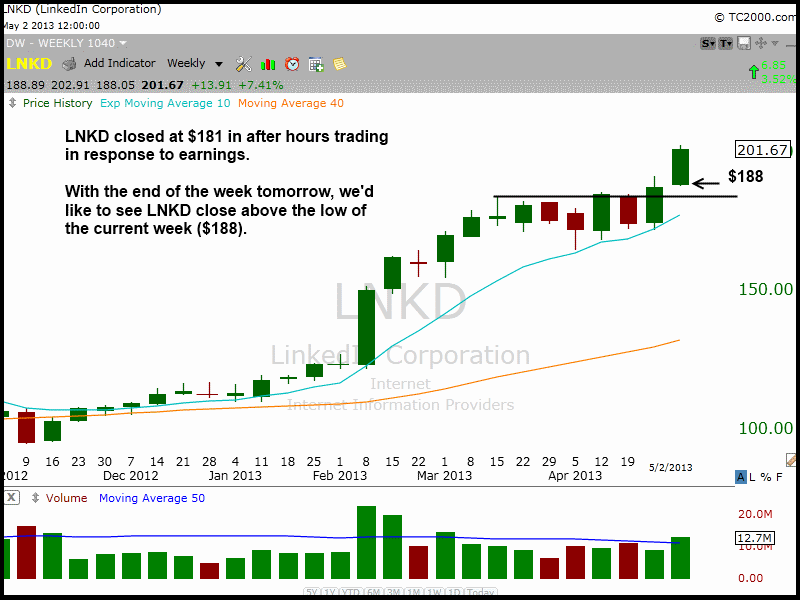
$LNKD reacted negatively to earnings and sold off sharply in after hours trading, closing at $181. The weekly chart will remain intact if $LNKD can close above $188 tomorrow. A close much below this level would produce an ugly looking candle with higher volume on the weekly chart.

$BLOX set a new closing high within the range on a slight pick up in volume. $P also broke out, but sold off late in the day. This setup still has a great chance of working out, as it needed to cool off a bit after running 8% higher in 6 bars on the hourly chart.
Money could flow back in to financials next week, as stocks like $C, $BAC, $GS, $MS, $JPM, and $BCS look like they are ready move higher after 6 to 8 weeks of basing action. We will review this sector over the weekend for potential buys.
relative strength combo watchlist:
Our Relative Strength Combo Watchlist makes it easy for subscribers to import data into their own scanning software, such as Tradestation, Interactive Brokers, and TC2000. This list is comprised of the strongest stocks (technically and fundamentally) in the market over the past six to 12 months. The scan is updated every Sunday, and this week’s RS Combo Watchlist can be downloaded by logging in to the Members Area of our web site.