Buy– Signal generated on the close of December 31 (click here for more details)
today’s watchlist (potential trade entries):

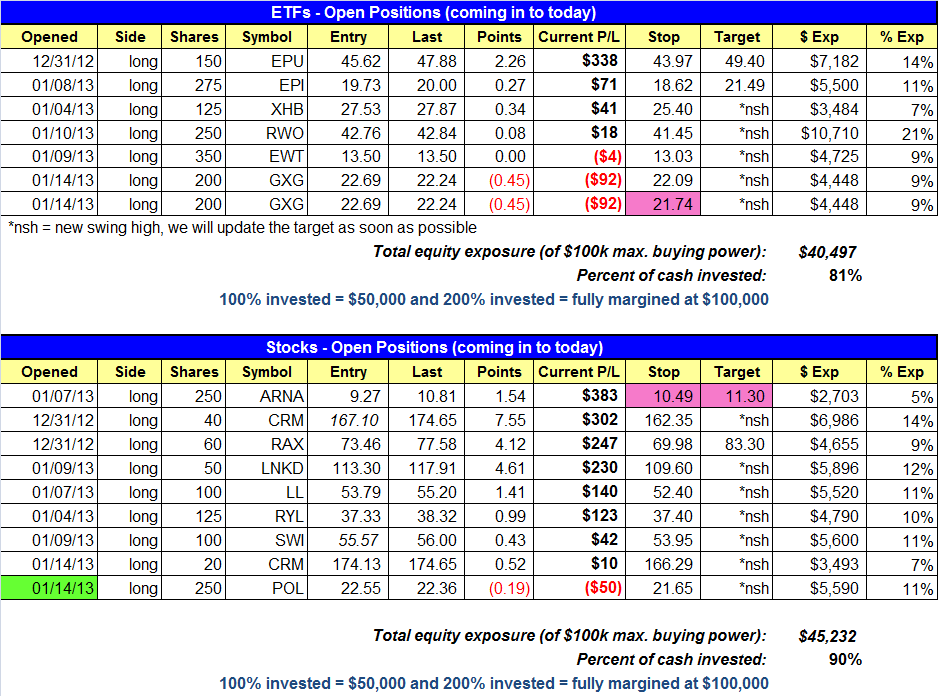
Having trouble seeing the open positions graphic above? Click here to view it directly on your web browser instead.
Below is an overview of all open positions, as well as a report on all positions that were closed only since the previous day’s newsletter. Net P/L figures are based on two separate $50,000 model portfolios (one for ETFs and one for stocks). Changes to open positions since the previous report are listed in pink shaded cells below. Be sure to read the Wagner Daily subscriber guide for important, automatic rules on trade entries and exits.
Having trouble seeing the open positions graphic above? Click here to view it directly on your web browser instead.
closed positions:

Having trouble seeing the closed positions graphic above? Click here to view it directly on your web browser instead.
ETF position notes:
- No trades were made.
stock position notes:
- $POL buy setup triggered.
ETF, stock, and broad market commentary:
The market has shown great resilience the past few weeks and Tuesday’s action did not disappoint. Once again the broad market averages overcame early selling action and managed to push higher the rest of the day, with most averages closing in positive territory. The only index to close in the red was the Nasdaq Composite. However, the Nasdaq was able to close near the highs of the day, which was impressive action considering the ugly action in $AAPL ($AAPL dropped 3.0%).
Total volume dropped off slightly on the Nasdaq, which prevented a second straight day of distribution. Yesterday’s bullish reversal candle on the S&P 500 was confirmed by a 4% pick up in volume on the NYSE. The bullish price and volume action points to higher prices for the S&P 500 in the short-term.
Since the beginning of the year, we have seen great resilience in the market (weak open & strong close), along with breakouts holding and new breakouts emerging. While the market has struggled to make much progress, conditions are improving and that is a good sign.
After reversing back above the 50-day MA from a large gap up on January 2, iShares NASDAQ Biotechnology Index ($IBB) rallied to the prior highs of October before pulling back in for a few days. Tuesday’s price action undercut a three-day low before reversing and closing near the highs of the day. The reversal action and strong close formed a bullish reversal candle on the daily chart below.

Ideally, we’d like to see $IBB pull back closer to the 20-day EMA for a lower risk entry, but the market doesn’t always give us a perfect setup. With that in mind we are placing $IBB on today’s watchlist with reduced share size.
iShares FTSE/Xinhua China 25 Index ($FXI) looks to be in consolidation mode after a strong rally off the 50-day and 200-day moving averages in mid-November. If so, the price action may need another week or two of consolidation before it is ready to run higher. We’d like to see the price action hold above the 20-day EMA while forming higher lows. $FXI is not actionable at this time but we will continue to monitor the pattern for a low risk entry point.

Just a heads up, $GXG is listed twice in the open positions section because we have split stops. We plan to cut half the position beneath Tuesday’s low if the price action fails to hold.
On to the stock side, we established one new position in the portfolio with a pullback entry in $POL. Although $POL triggered on strong action it failed to follow through and retreated well off the highs of the day. Let’s see if buyers step in tomorrow.
Please note that we have lowered the target in $ARNA and raised the stop. With a target of 11.30, we are looking for a 5% move from Tuesday’s close. We are willing to give back 3% to get the additional 5% (near 2 to 1 ratio), which is why our stop was raised to 10.49.
There are no new official setups for today. $REGN remains on the watchlist with a new entry and stop price.
If you are a new subscriber, please e-mail [email protected] with any questions regarding our trading strategy, money management, or how to make the most out of this report.
relative strength combo watchlist:
Our Relative Strength Combo Watchlist makes it easy for subscribers to import data into their own scanning software, such as Tradestation, Interactive Brokers, and TC2000. This list is comprised of the strongest stocks (technically and fundamentally) in the market over the past six to 12 months. The scan is updated every Sunday, and this week’s RS Combo Watchlist can be downloaded by logging in to the Members Area of our web site.