market timing model:
Buy – Signal generated on the close of December 18 (click here for more details)
today’s watchlist (potential trade entries):

Having trouble seeing the open positions graphic above? Click here to view it directly on your web browser instead.
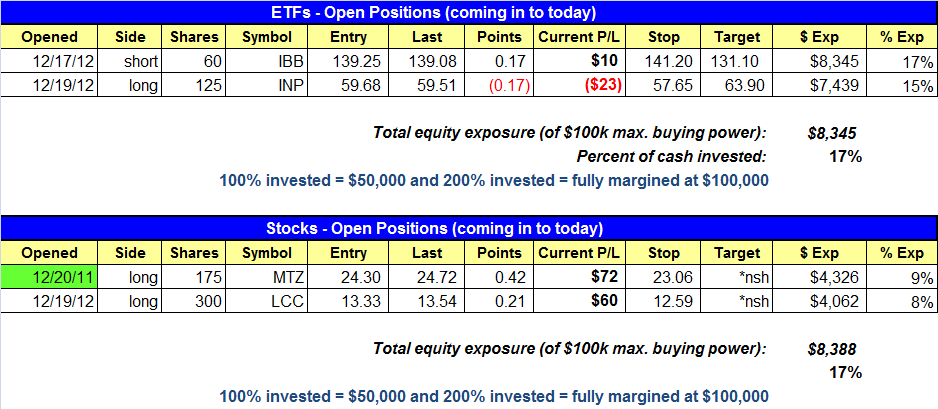
open positions:
Below is an overview of all open positions, as well as a report on all positions that were closed only since the previous day’s newsletter. Net P/L figures are based on two separate $50,000 model portfolios (one for ETFs and one for stocks). Changes to open positions since the previous report are listed in pink shaded cells below. Be sure to read the Wagner Daily subscriber guide for important, automatic rules on trade entries and exits.
Having trouble seeing the open positions graphic above? Click here to view it directly on your web browser instead.
closed positions:

Having trouble seeing the closed positions graphic above? Click here to view it directly on your web browser instead.
ETF position notes:
- No setups triggered.
stock position notes:
- $MTZ buy setup triggered.
- $ILMN buy setup was canceled due to gap up of more than 1.3% above our trigger. To avoid getting filled on large gap ups place a buy stop limit order, which allows you to set a buy trigger plus a limit price as protection to prevent higher than expected fills. The limit price can be 1.3% above the trigger.
ETF and broad market commentary:
After selling off on the open, stocks oscillated in a choppy, sideways range throughout the morning before grinding their way into positive territory in the afternoon. Both the S&P 500 and Dow Jones Industrial Average ticked 0.5% higher, while the Nasdaq Composite lagged with a 0.2% gain. As might be expected ahead of the week between Christmas and New Years Day holidays, turnover was lighter across the board. The major indices finished at their intraday highs, but near the middle of the previous day’s trading ranges.
Earlier this week we mentioned the pick up in buying in the energy sector with $XLE breaking a short-term downtrend line and reclaiming its 50-day MA. The iShares Dow Jones Transportation ($IYT) has also perked up after breaking a year long downtrend line. There is no actionable setup right now, as we’d like to see $IYT form a 5-10 week base while holding above 92.00. An eventual breakout from this base would be the ideal entry point.

In yesterday’s report, we listed a potential breakout setup forming in Global X InterBolsa FTSE Colombia20($GXG). Another South American ETF showing in a tight consolidation pattern is iShares MSCI All Peru Capped Index Fund ($EPU). Check out the weekly chart below:

$EPU has been in base mode since last March and has tightened up nicely over the past few months above the 20 and 50-week moving averages. A breakout above the tight range would also result in a break of the long-term downtrend line in blue. We are monitoring the action for a potential entry point within the next few weeks.
After breaking the uptrend line at the lows of its base, the iShares Barclays 20+ Yr Treasury Bond ETF ($TLT) has broken suport of the 200-day MA for the third time since September. We also see two consecutive lower swing highs since the price action topped out this summer. $TLT is in danger of establishing a downtrend if it is unable to reclaim the 200-day MA and breaks down below 118.00. The next support level would then be around 111.00.

In case you didn’t notice, we lowered the protective stop on our $IBB short position yesterday. The new stop is just above the high of the December 19 reversal bar. If $IBB gets back above that price, we no longer want to be short because buying momentum would likely increase. With the new stop, our risk on the trade has been limited to just over $100, which is only one-fifth of our maximum risk of $500 per trade (1% of the model portfolio cash value). $IBB is now testing support of its 20-day EMA, and a convincing breakdown below that level could put bearish momentum back in our favor for this trade (which was originally based on the “head and shoulders” pattern on the weekly chart).
Next week, we will be publishing The Wagner Daily on a limited holiday schedule. Look for an e-mail sometime Friday that details next week’s schedule for publication of the letter, live webinars, and live trading room. Have a great weekend and watch out for the mad rush of last minute holiday shoppers!
stock commentary:
$MTZ broke out on decent volume yesterday and closed near the highs of the day. We are not looking to add more long exposure the next few days as we expect trading to be light. Also, at the time of this writing US futures were down considerably, so we could see some heavy selling on Friday.
Although it seems as though we are getting in a little late here with recent buy entries, we must remind everyone that earlier entry points (from Nov. 23 buy signal) in late November and early December did not produce great results. So this is not the first time we have attempted to go long since the market bottomed; however, since the market bottomed this is the first time that we have seen stocks follow through to the upside. We try to trust all buy signals until the prove us wrong. Once there is a buy signal in place, our focus shifts from the broad market averages to the individual stock setups. Of course we’ll continue to monitor the broad market for distribution days as they can destroy a rally, but our day to day focus is now on leadership stocks and how they are acting.
If you are a new subscriber, please e-mail [email protected] with any questions regarding our trading strategy, money management, or how to make the most out of this report.
relative strength combo watchlist:
Our Relative Strength Combo Watchlist makes it easy for subscribers to import data into their own scanning software, such as Tradestation, Interactive Brokers, and TC2000. This list is comprised of the strongest stocks (technically and fundamentally) in the market over the past six to 12 months. The scan is updated every Sunday, and this week’s RS Combo Watchlist can be downloaded by logging in to the Members Area of our web site.