Portfolio exposure can be anywhere from 0% to 60% long (or more), depending on how open positions have held up the past three days.
Past signals:
- Buy signal generated on close of November 13
- Buy signal generated on close of September 9
- Neutral signal generated on close of August 15
- Buy signal generated on close of July 11
- Neutral signal generated on close of July 5
- Sell signal generated on close of June 24
today’s watchlist (potential trade entries):

Having trouble seeing the open positions graphic above? Click here to view it directly on your web browser instead.
open positions:Below is an overview of all open positions, as well as a report on all positions that were closed only since the previous day’s newsletter. Changes to open positions since the previous report are listed in pink shaded cells below. Be sure to read the Wagner Daily subscriber guide for important, automatic rules on trade entries and exits.

Having trouble seeing the open positions graphic above? Click here to view it directly on your web browser instead.
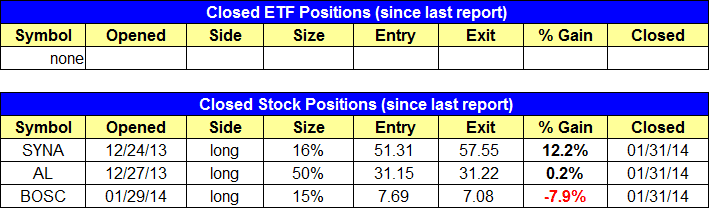
closed positions:
Having trouble seeing the closed positions graphic above? Click here to view it directly on your web browser instead.
ETF position notes:
- Bought $UNG on a buy limit order.
stock position notes:
- Stops in $AL, $SYNA, and $BOSC triggered.
ETF, stock, and broad market commentary:Last Friday’s significant gap down on the open put immediate pressure on those who established new long positions based on last Thursday’s positive close. Despite the weak open, stocks rallied higher most of the day before giving way to selling pressure in the final two hours of trading. The late selloff was disappointing for the bulls, as the market failed to produce an accumulation day in three attempts last week. As such, the volume pattern remains bearish on the NYSE and Nasdaq.
The end of January saw a big jump in market volatility, with three significant gaps on the open last week alone. When volatility increases, it becomes difficult to manage risk. When the market is in trend mode, traders can get away with late entries due to the strength and reliability of an uptrend. However, when distribution hits the market and volatility picks up, late entries can be punished in a hurry.
Aside from Natural Gas and gold, we are not looking at new longs right now as we are content to manage open positions while waiting for market conditions to settle down.
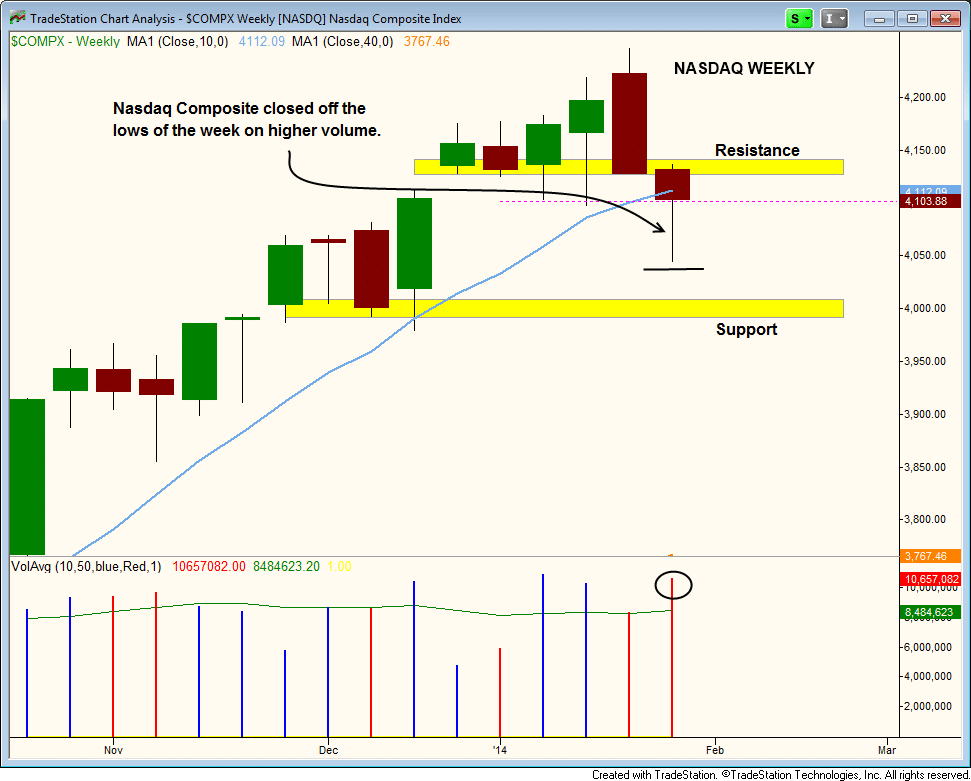
The Nasdaq Composite managed to close off the lows of the week, but just below the 10-week MA (in light blue) on the weekly chart below. If the Nasdaq breaks last week’s low this week, then a test of the $4,00 level is likely in short order. However, if last week’s low holds, then the market may take a few more weeks to hit this level. Either way, it looks as though the Nasdaq will eventually hit $4,000 within the next several weeks (this is not a prediction, as ANYTHING can happen).
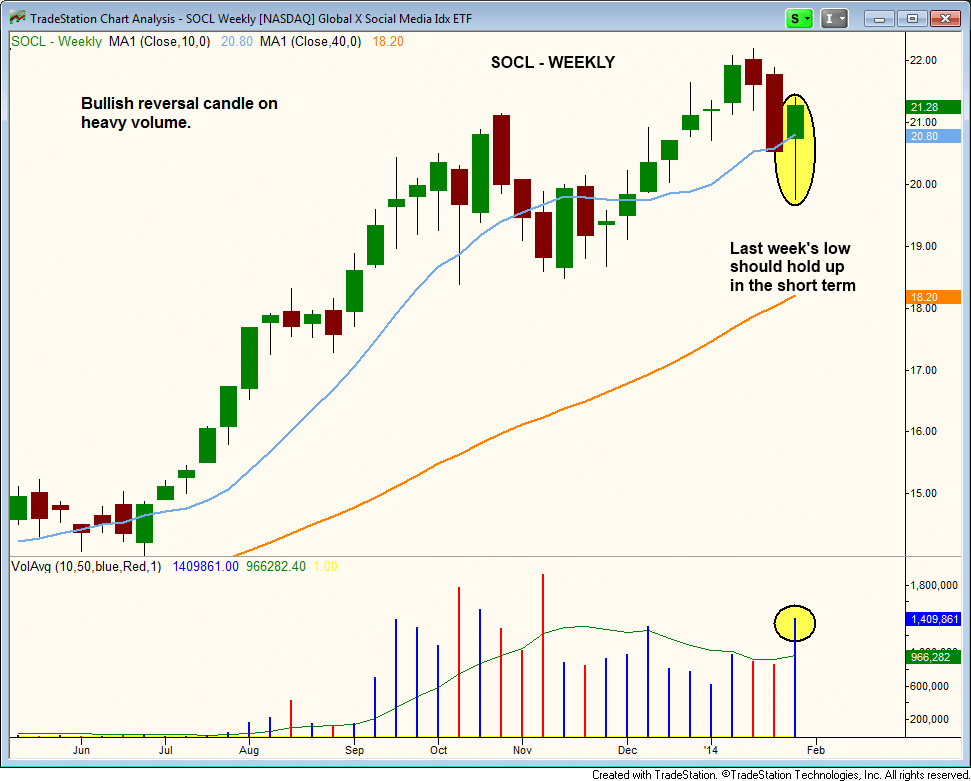
Facebook’s ($FB) positive reaction to earnings gave a much needed lift to our long position in the Global X Social Media ETF ($SOCL). $SOCL closed with a bullish reversal candle on higher volume. Last week’s low should hold up in the short-term, but the action will need several weeks of consolidation in a fairly tight range to work off the recent volatility.
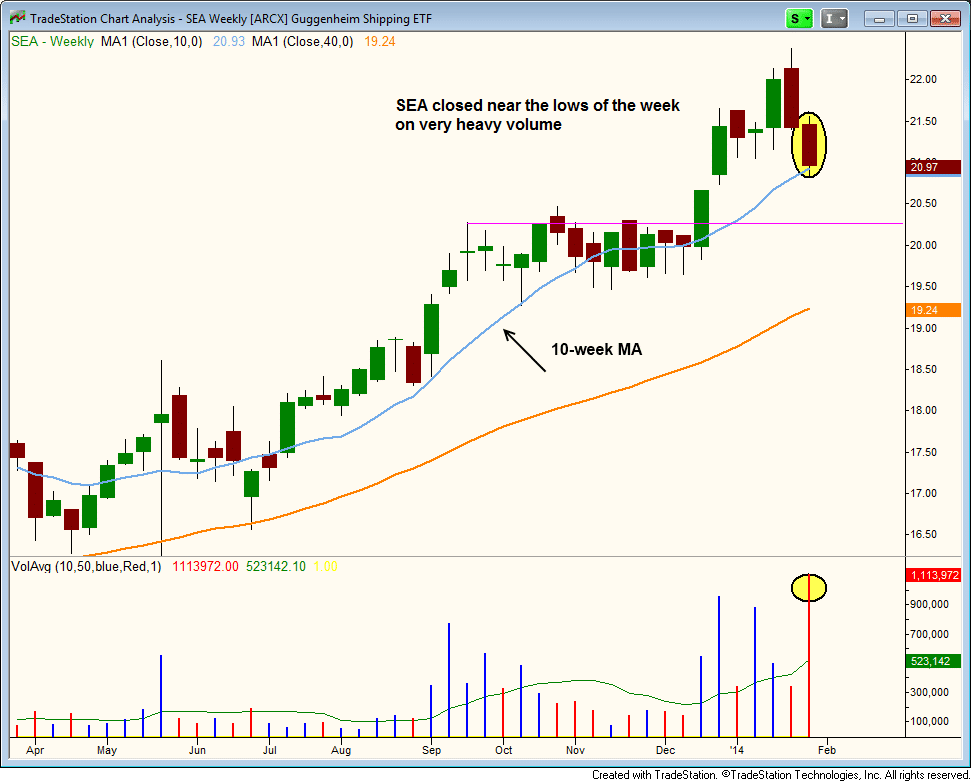
 Our current long position in Shipping ETF ($SEA) sold off but closed above the 10-week MA on very heavy volume. Most of the week’s volume was on one day (1/29), which was a tight ranged session that gapped lower on the open. If last week’s heavy volume was truly dsistribution, then the price action will slice through the 10-week MA within in the next week or two. If the volume as support, then last week’s low should hold up with a little wiggle room.
 Overall, leadership stocks have held up better than expected, which has prevented us from shiting the timing model to a sell signal.
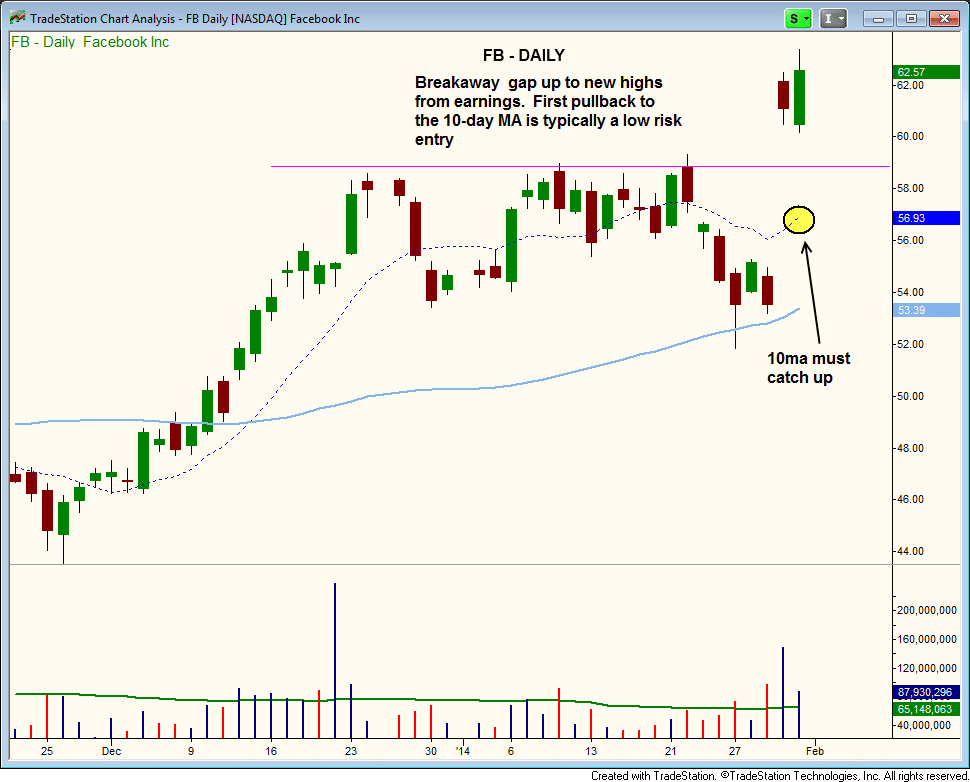
On the stock side, Facebook’s ($FB) reaction to earnings puts us in a great spot with our current position. If the price action fails to hold above the 10-day MA, then we will likely be out with an 18% gain. However, if $FB can hold the 10-day MA, then we may look to add to the position, as the 10-day MA is often a great spot to get long on breakaway gap up (but much will depend on broad market conditions).
 Overall, leadership stocks have held up better than expected, which has prevented us from shiting the timing model to a sell signal.
Facebook’s ($FB) reaction to earnings puts us in a great spot with our current position. If the price action fails to hold above the 10-day MA, then we will likely be out with an 18% or so gain. However, if $FB can hold the 10-day MA, then we may look to add to the position.
The 10-day MA is often a great spot to get long on breakaway gap ups, but much will depend on broad market conditions.